
Understand your dashboard figures
Read the four visit cards, the chart and Top Categories on the Dashboard, and what each message under a figure means.
- Goal
- You can read the four visit cards on the Dashboard and you know what each message under a figure means.
- Before you start
- You are signed in to your restaurant
- A published menu, so that guests can open it (see Publish your menu)
The Dashboard shows how guests use your menu: four cards, a chart and Top Categories. These figures come from real visits to your menu, never from sample data. Nothing is estimated: when RothDine has no figure, it tells you why instead of showing a zero. The cards are for roles that may view analytics (owner, admin, branch manager, order manager, menu editor, viewer). For the orders and the kitchen, open the Analytics page.
Find the four cards and the date range
Open Dashboard in the sidebar. Under the welcome line you see the date range and four cards: Menu Views, Unique Visitors, Avg. Time on Menu and Item Favourites. The cards follow the branch chosen in the top bar (All branches or one branch).
- Menu Views counts visits to your menu. A visit is one continuous use of a branch menu by one browser. It ends after 30 minutes without activity, and refreshing the page does not start a new one.
- Unique Visitors counts different browsers. Someone who clears their browser data, or opens the menu on a second phone, counts again.
- Avg. Time on Menu is the average time guests actively used the menu. Time with the page hidden or without touching it is not counted.
- Item Favourites counts the times a guest marked a dish as a favourite, once per dish and visit.
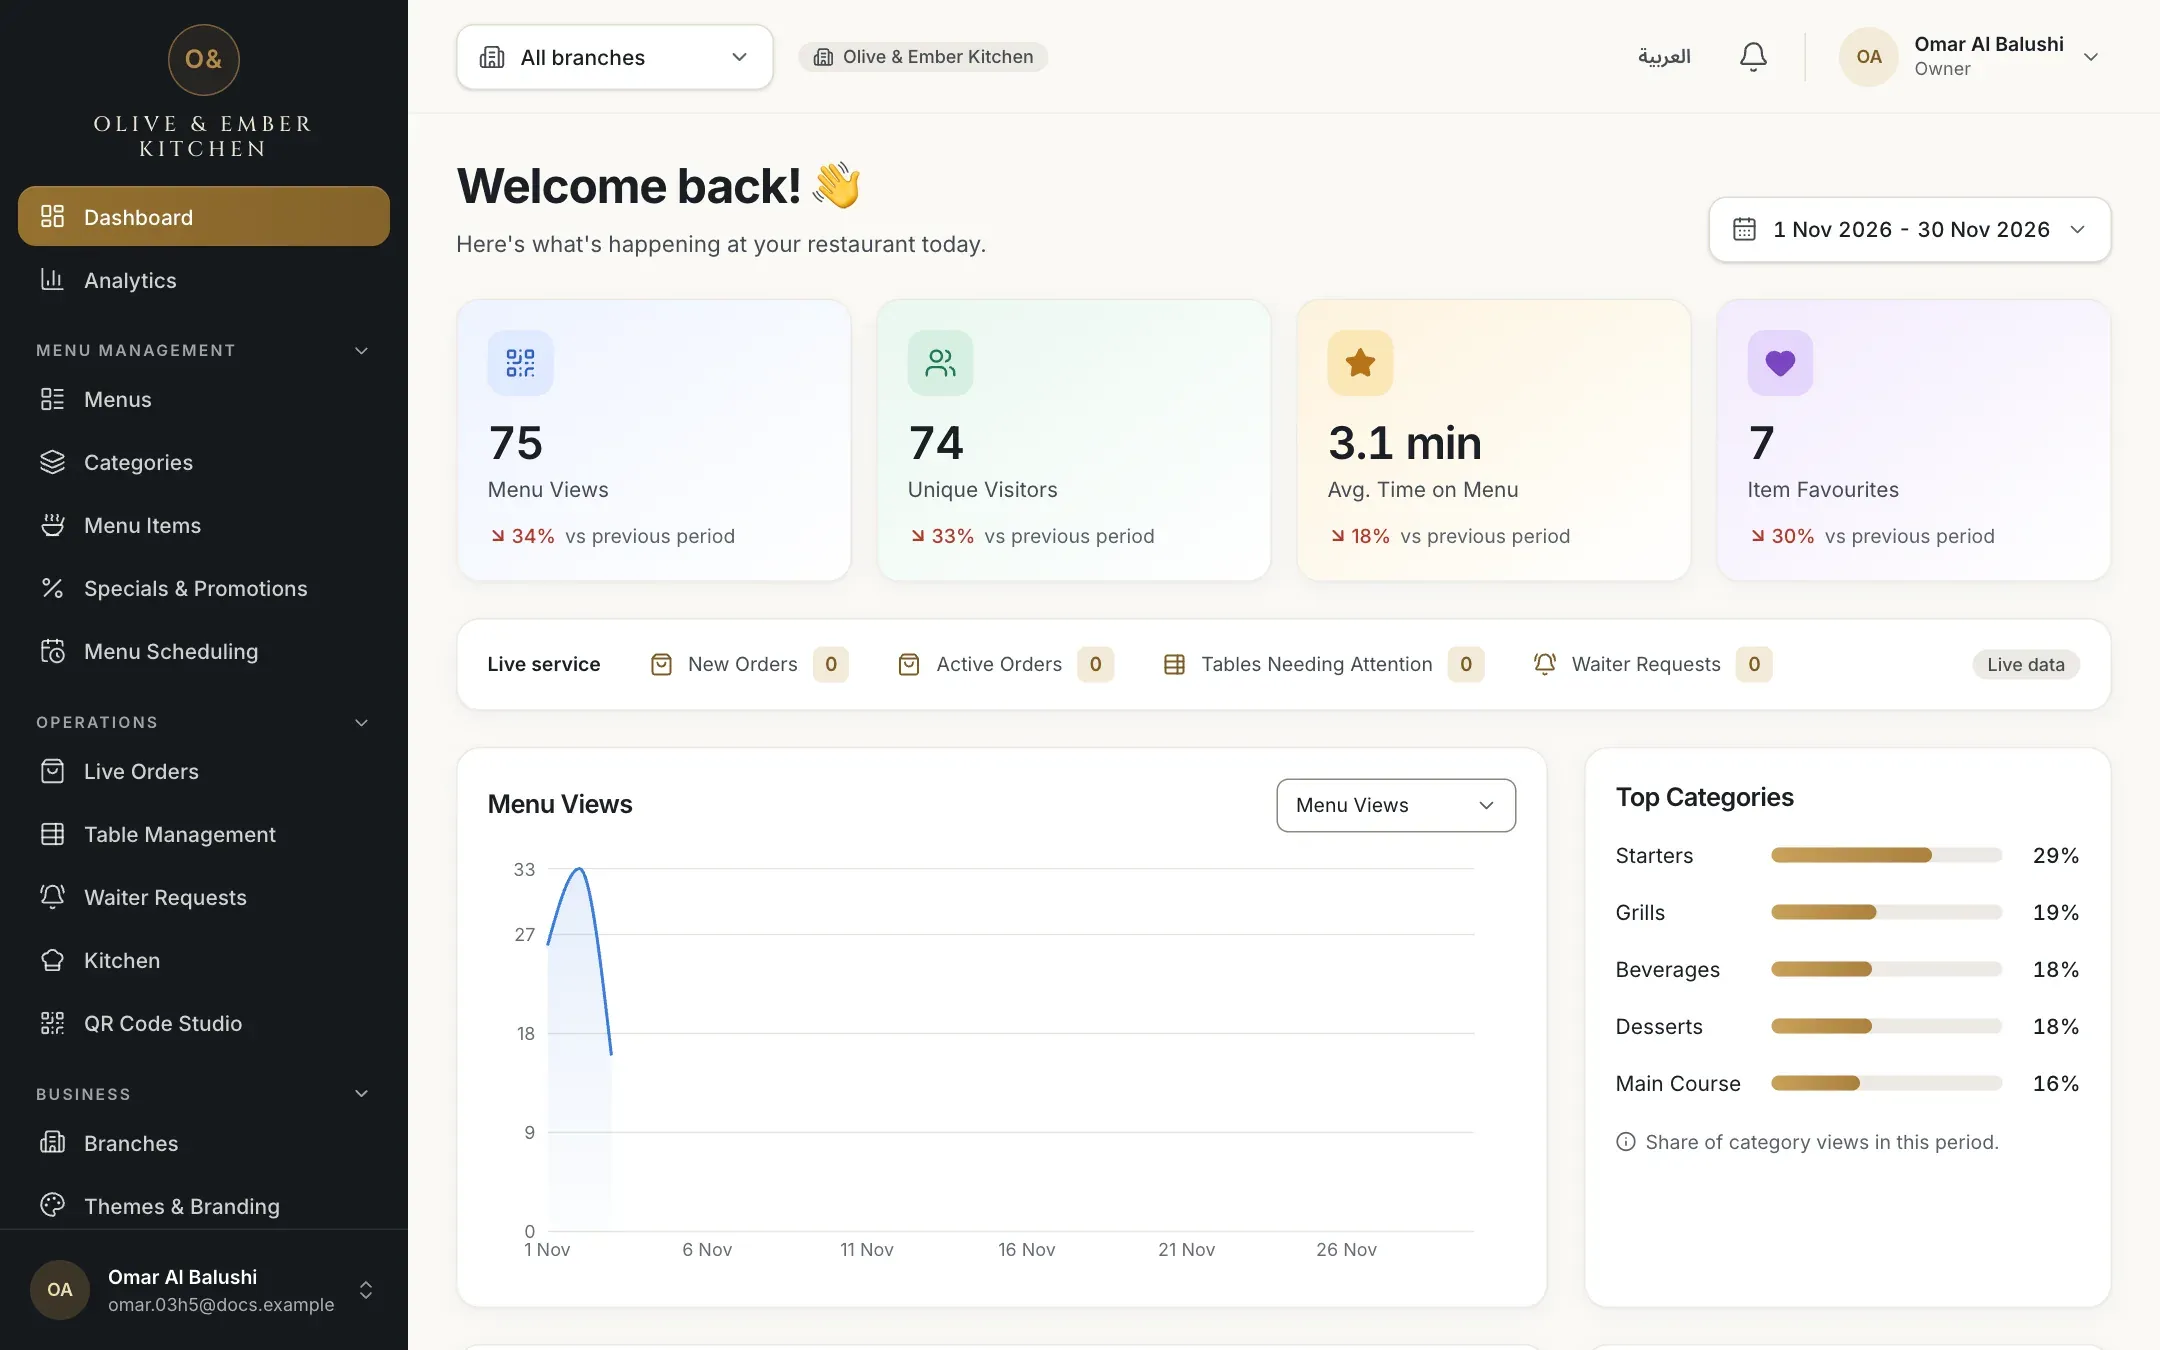
- The date range
- Menu Views
- Unique Visitors
- Avg. Time on Menu
- Item Favourites
Choose the date range
Click the date range. The list offers the whole current month, Last 14 days, Last 7 days and First week. Days are counted in your restaurant's time zone, not the time zone of your computer. A range never counts days that have not happened yet, so "this month" ends today.
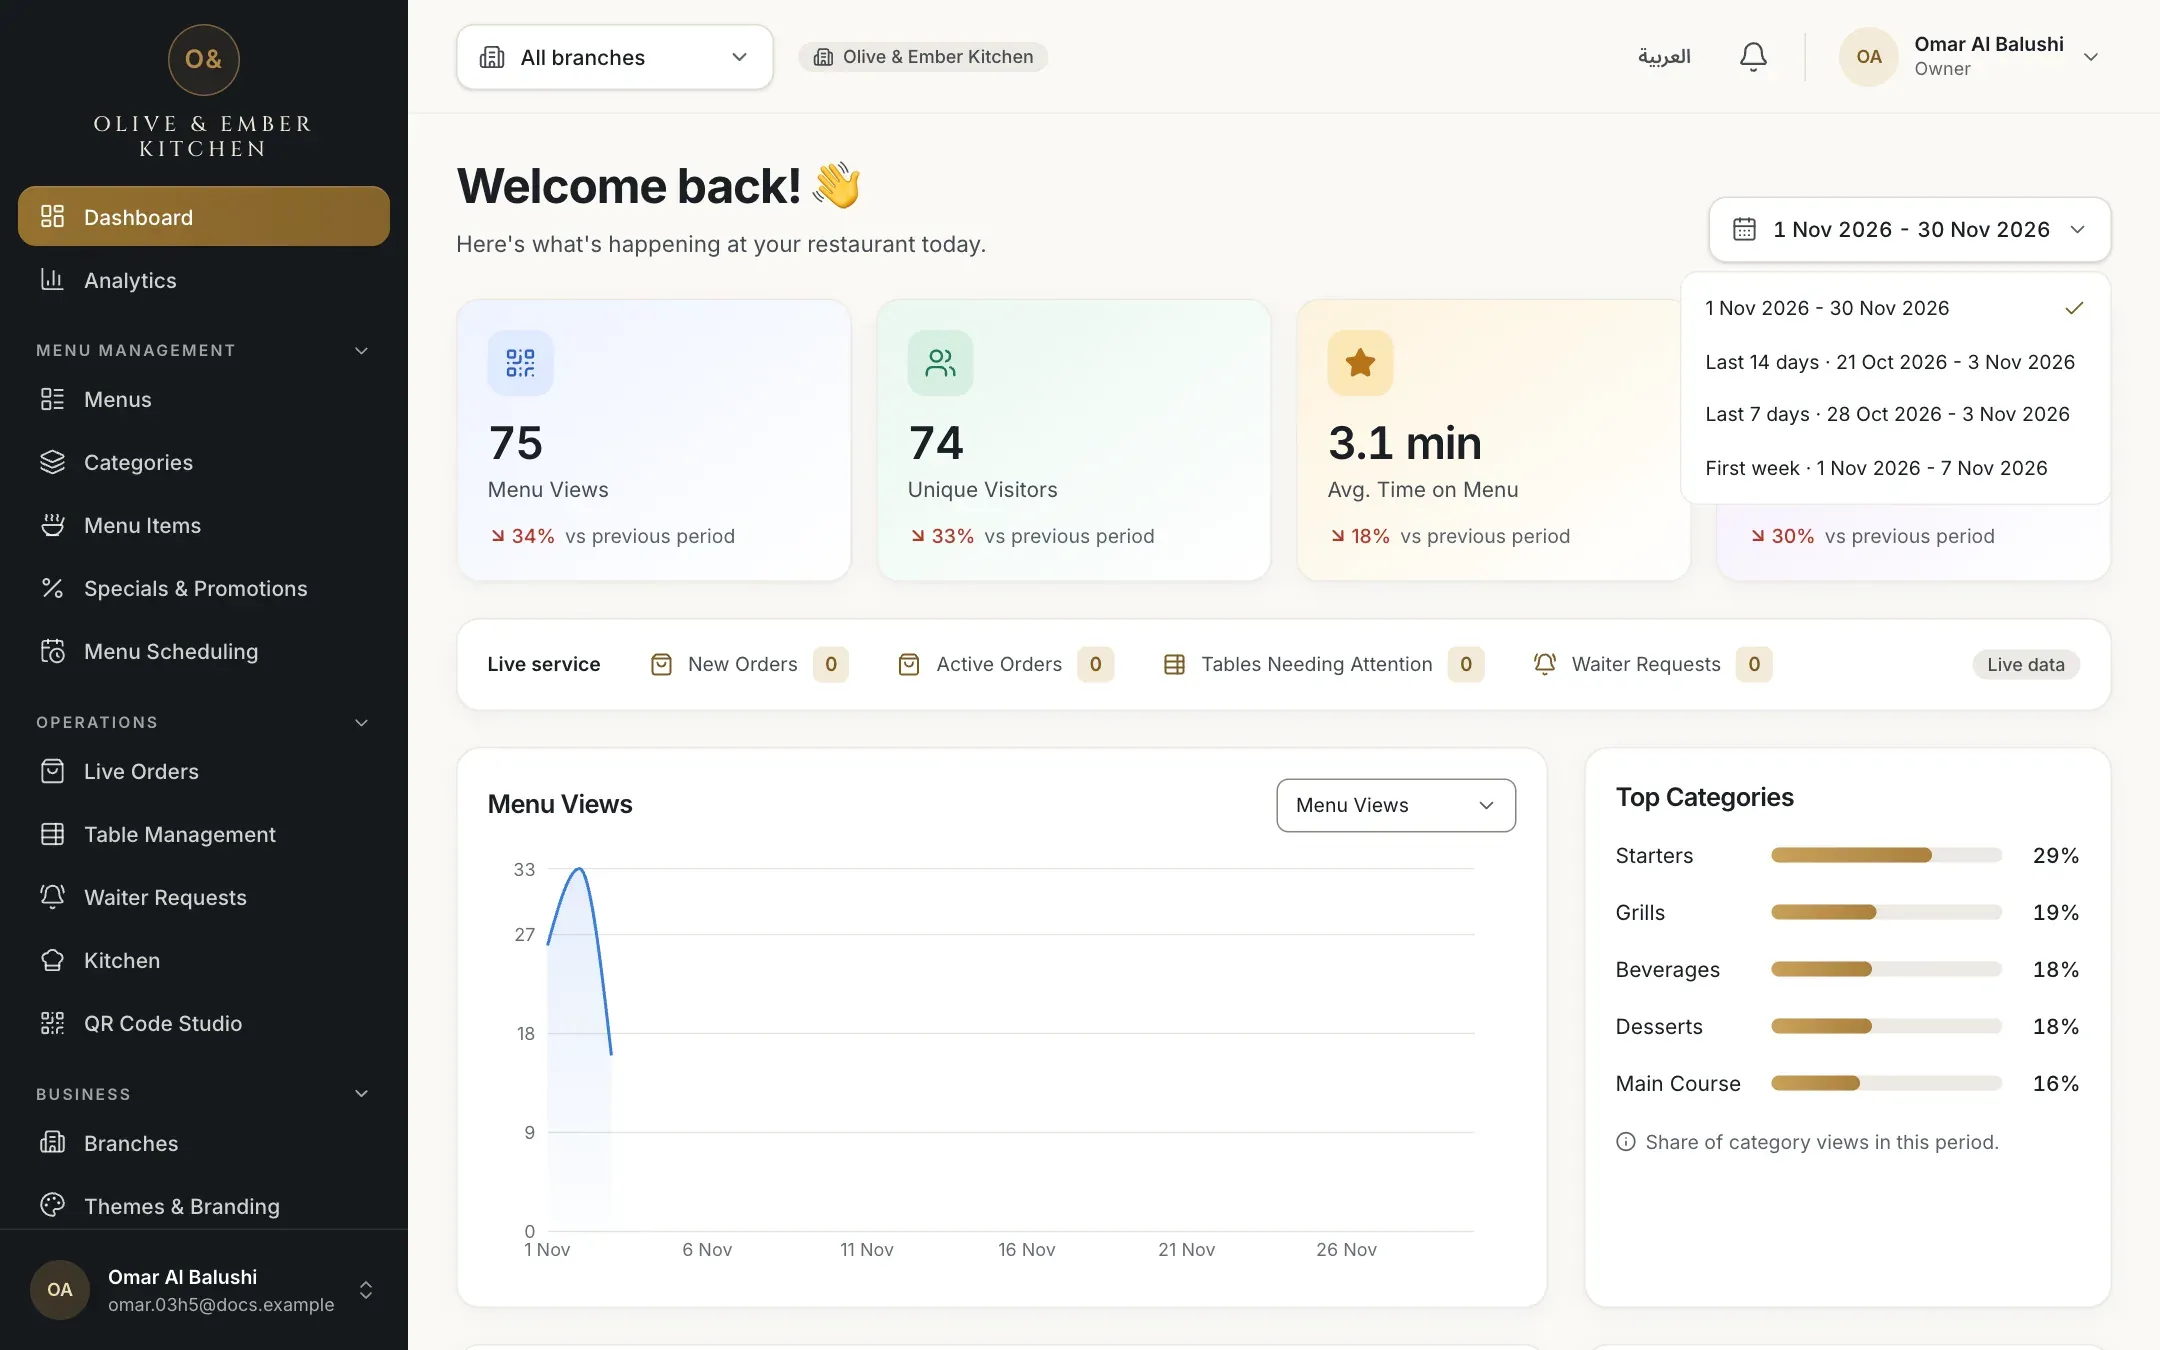
- The list of ranges
Read the chart and Top Categories
The chart draws one point per day for the figure chosen in the list above it: Menu Views, Unique Visitors or Item Favourites. A day before tracking began, or a day still to come, is a gap in the line, not a zero. Top Categories shows the share of category views in the period for your five most viewed categories. If nobody has opened a category yet, the bars stay empty and a note says so.
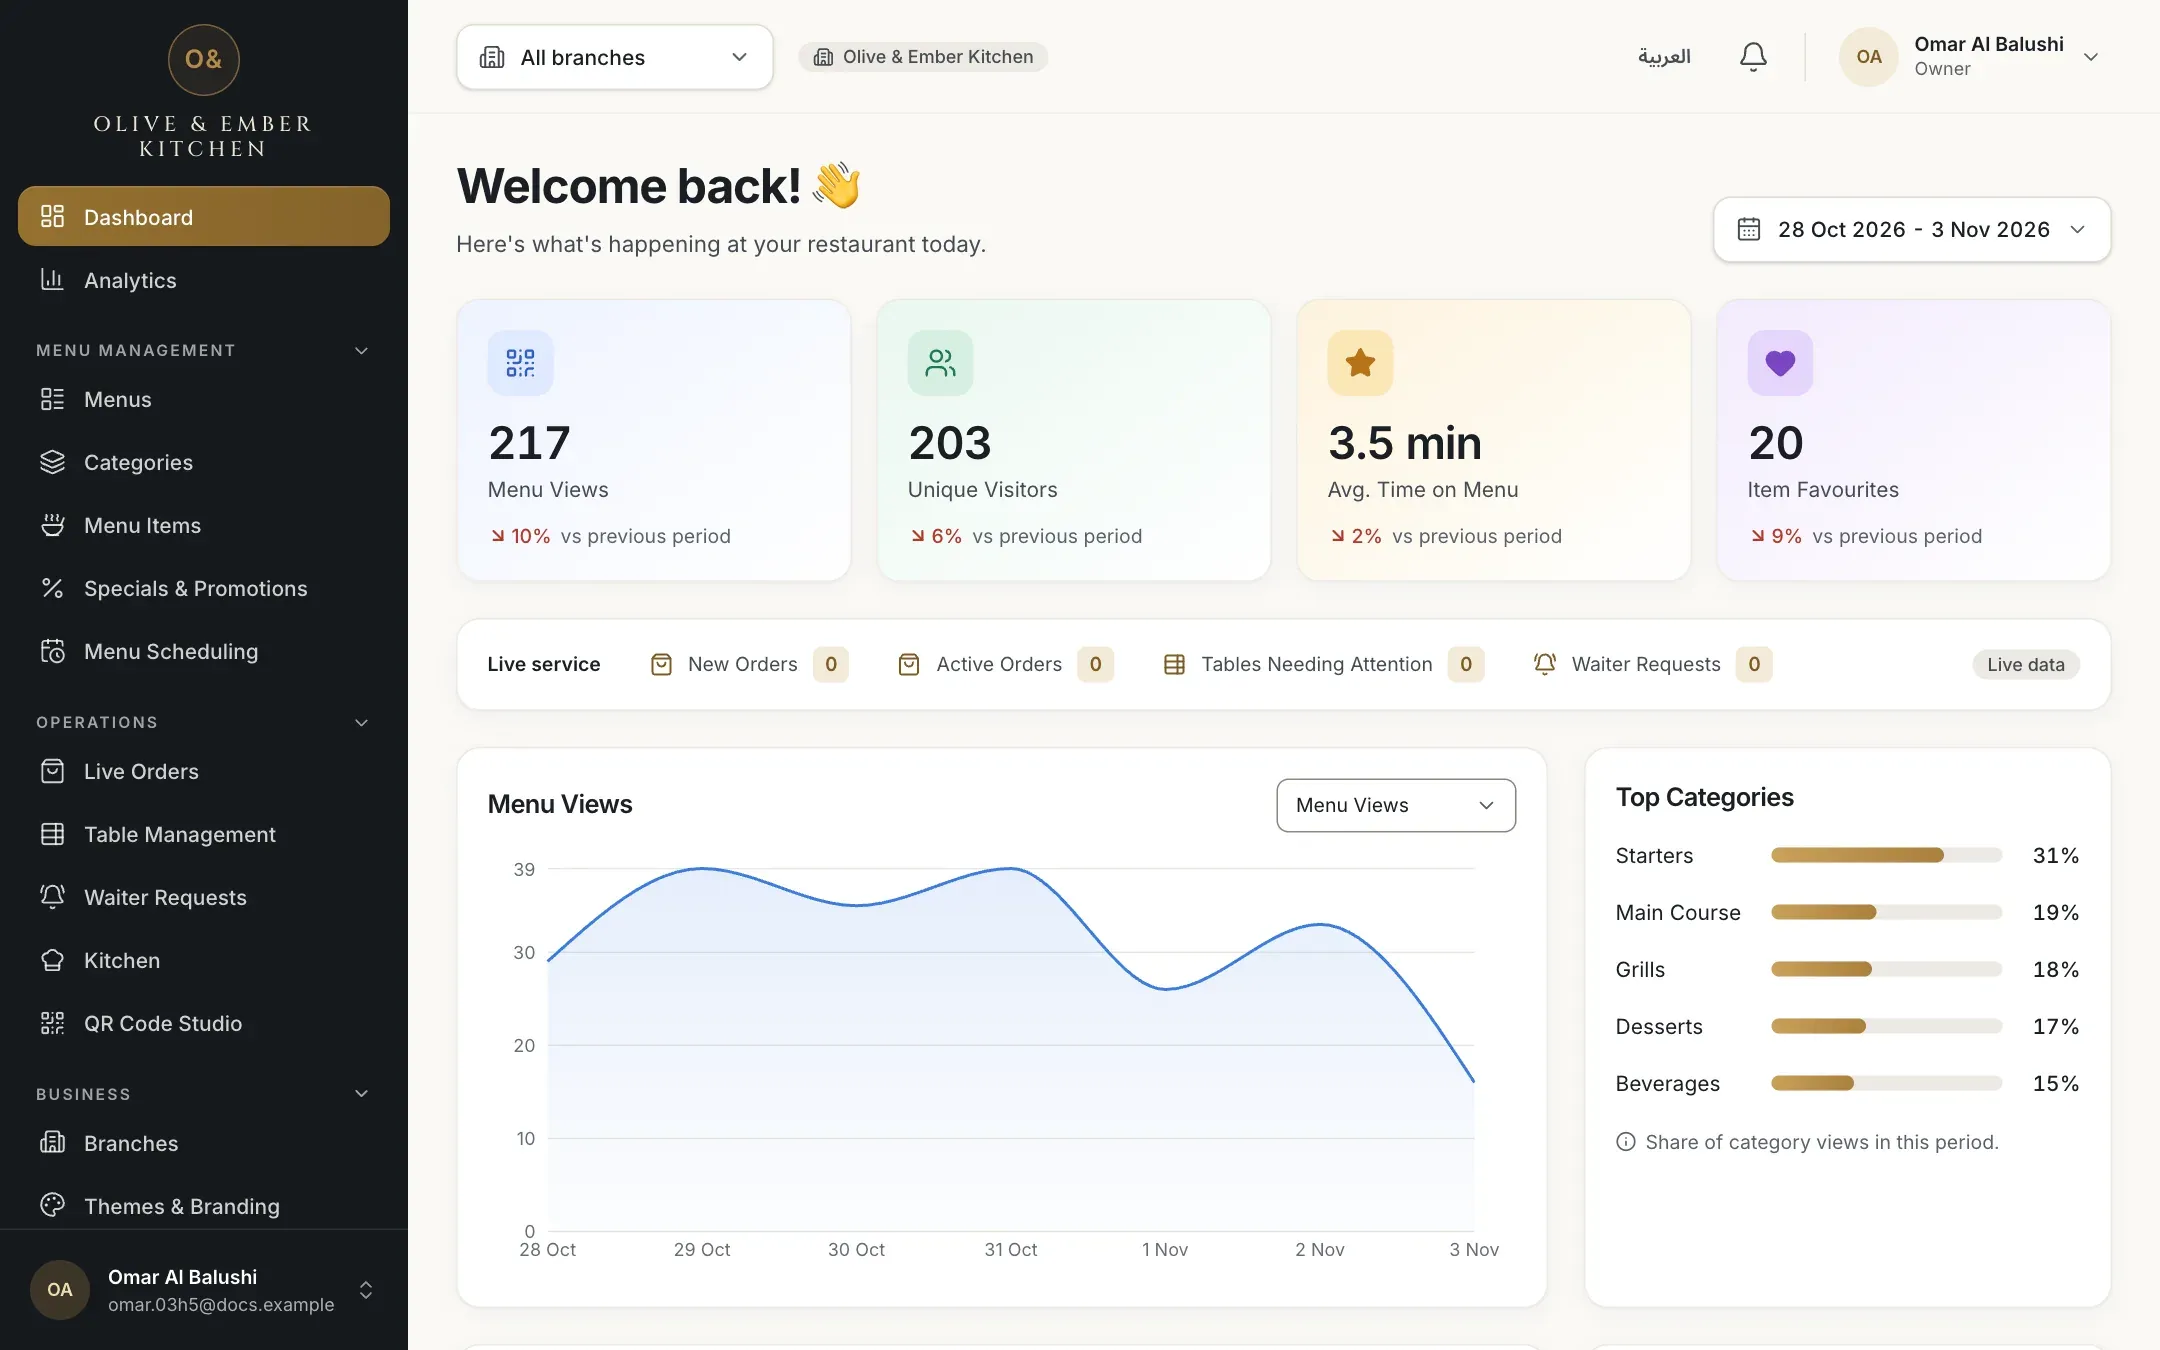
- The list that chooses the figure
- The daily chart
- Top Categories
Read the comparison line
Under each figure, a line such as 34% vs previous period compares the range with the previous range of the same length. A green arrow up means more than before, a red arrow down means less. RothDine shows a percentage only when the comparison is fair: the previous period must have enough visits (at least 5 for a count, at least 10 measured visits for the average time) and tracking must already have been running during it.

- The change for Menu Views
- The change for Avg. Time on Menu
Know what "Tracking started" means
Counting visits began on a certain day. If your range starts before that day, the figure counts only from that day and the card says Tracking started 1 Nov 2026 (with your date). RothDine never invents earlier days, and no percentage is shown, because there is nothing to compare with.

- Menu Views, counted from the start date
- Unique Visitors, counted from the start date
Know what "Tracking was not active in this period" means
If the whole range is before counting began, every card shows a dash and Tracking was not active in this period, and the chart says Visit tracking started later. Nothing is estimated. A dash is not a zero: it means nothing was measured. Choose a range that starts on or after the start date.
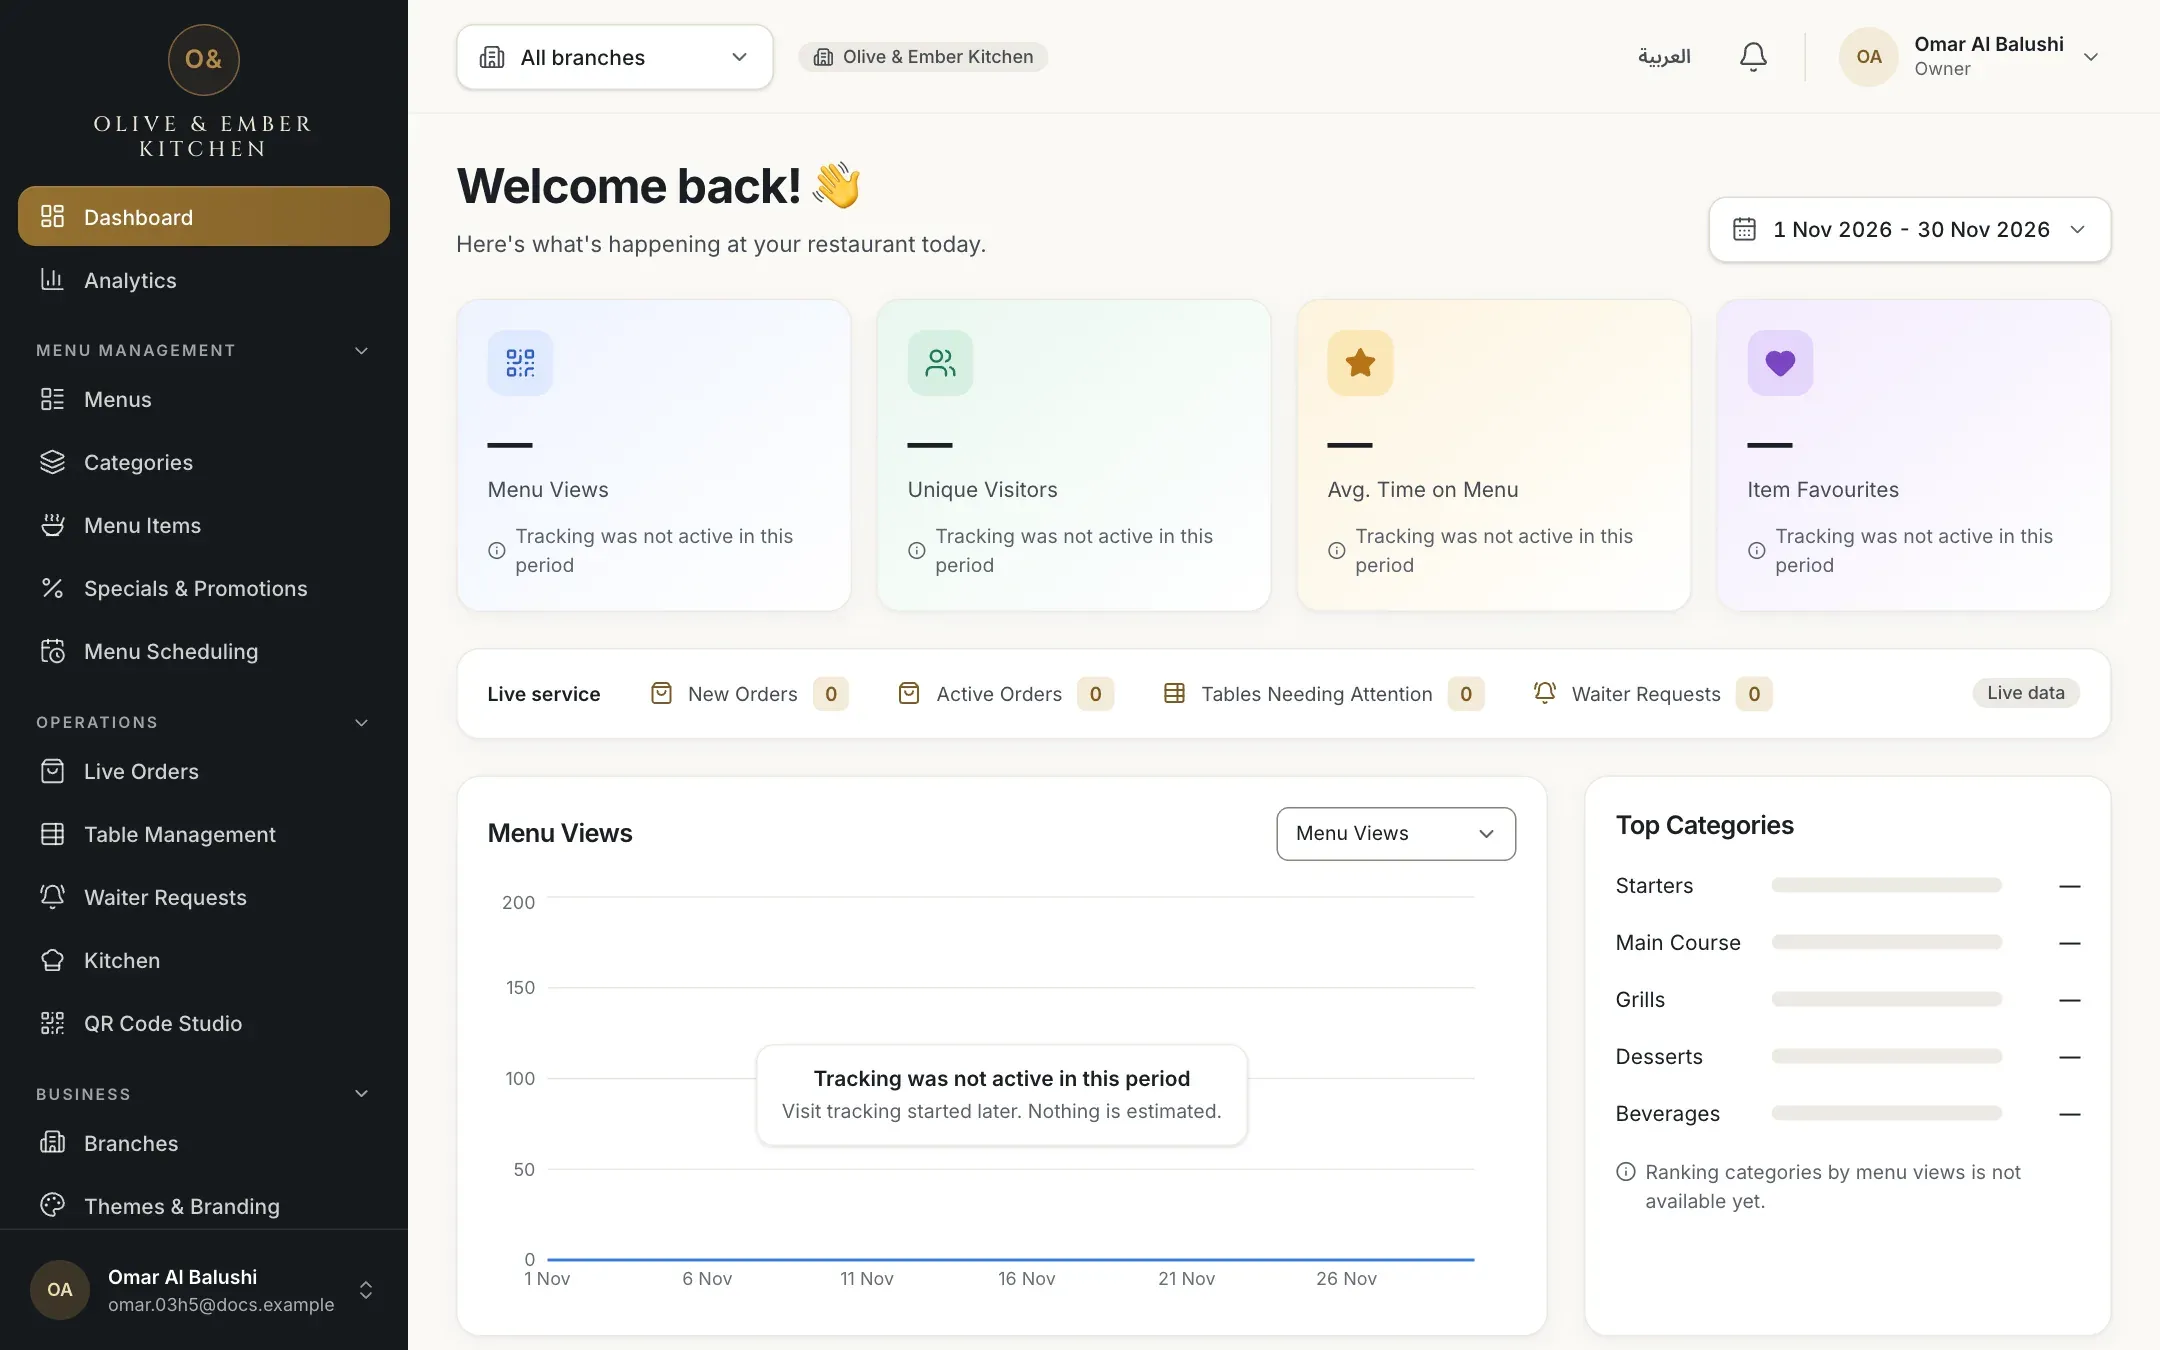
- The message on the Menu Views card
- The message over the chart
Know what "No comparable previous data" means
The figure is real, but the previous range cannot be compared fairly, for example because counting had not started yet or there were too few visits. The card then shows No comparable previous data instead of a percentage.

- Menu Views with no percentage
- Item Favourites with no percentage
Know what "Not enough visits yet" means
A new restaurant has no visits yet. A real zero is shown as the number 0, as on Menu Views below. Avg. Time on Menu cannot be calculated from nothing, so it shows a dash and Not enough visits yet until guests have used the menu.

- A real zero
- Not enough visits yet
What these figures are not
They count visits to the menu, not orders and not payments. For orders, order value and kitchen times use the Analytics page. The figures cover only the days since counting began, and one person on two phones counts as two visitors.
Troubleshooting
The figures could not be fetched. Click Retry under the card. If it keeps failing, check your connection and reload the page. Nothing is lost.
This message on the four cards means your role cannot view analytics, for example the waiter role. Ask the owner if you need to see how the menu is used.
Counting visits started later than the range you chose. Pick a range from the start date onwards. Orders on the Analytics page are not affected.
The previous period has too few visits, or counting had not started in it. The figure itself is correct. Choose a longer range, or wait until more days have passed.
No guest opened a category in this period yet, so there is nothing to rank. The note under the bars says No category views in this period yet.
Related guides
- Analytics and insightsOpen the Analytics pageOpen Analytics, choose a period, a branch and the comparison, jump between sections and share the view with a colleague.
- Analytics and insightsUnderstand QR scans and menu visitsLearn exactly what QR scans, menu views, visitors, devices and time on menu count, and where these figures are less exact.
- Analytics and insightsExport analytics as CSVDownload seven CSV files for the period and branch you chose, and open them in Excel or Google Sheets, also in Arabic.