
Understand QR scans and menu visits
Learn exactly what QR scans, menu views, visitors, devices and time on menu count, and where these figures are less exact.
- Goal
- You can read QR scans, menu views, unique visitors, devices and time on menu, and you know the limits of each figure.
- Before you start
- Your role may view analytics
- A published menu and at least one active QR code
RothDine counts how guests reach and use your menu without asking anything of them. It stores no names, phone numbers, e-mail addresses or IP addresses. Each browser gets a random code that is stored only in that browser and is not linked to a person or an account. The figures start on the day counting began, so they are exact for what was counted but they are not a census of everyone who ever looked at the menu.
Read the three cards: scans, views and visitors
In Overview three cards belong to this guide.
- QR scans: how many times a QR code of yours (table, branch or restaurant) was opened by a real browser. The same person scanning the same code again within 30 minutes counts once. Scans by search engines, link previews and automated tools are ignored, and so are codes that are disabled.
- Menu views: the number of visits. A visit is one continuous use of one branch menu by one browser. It ends after 30 minutes of inactivity, and refreshing the page does not start a new visit. Opening the menu in a new browser tab can start a new one.
- Unique visitors: the number of different browsers that visited. One browser is one visitor: a refresh never makes a new visitor, but someone who clears their browser data, uses private browsing or a second phone counts again. Two people sharing one phone count once.
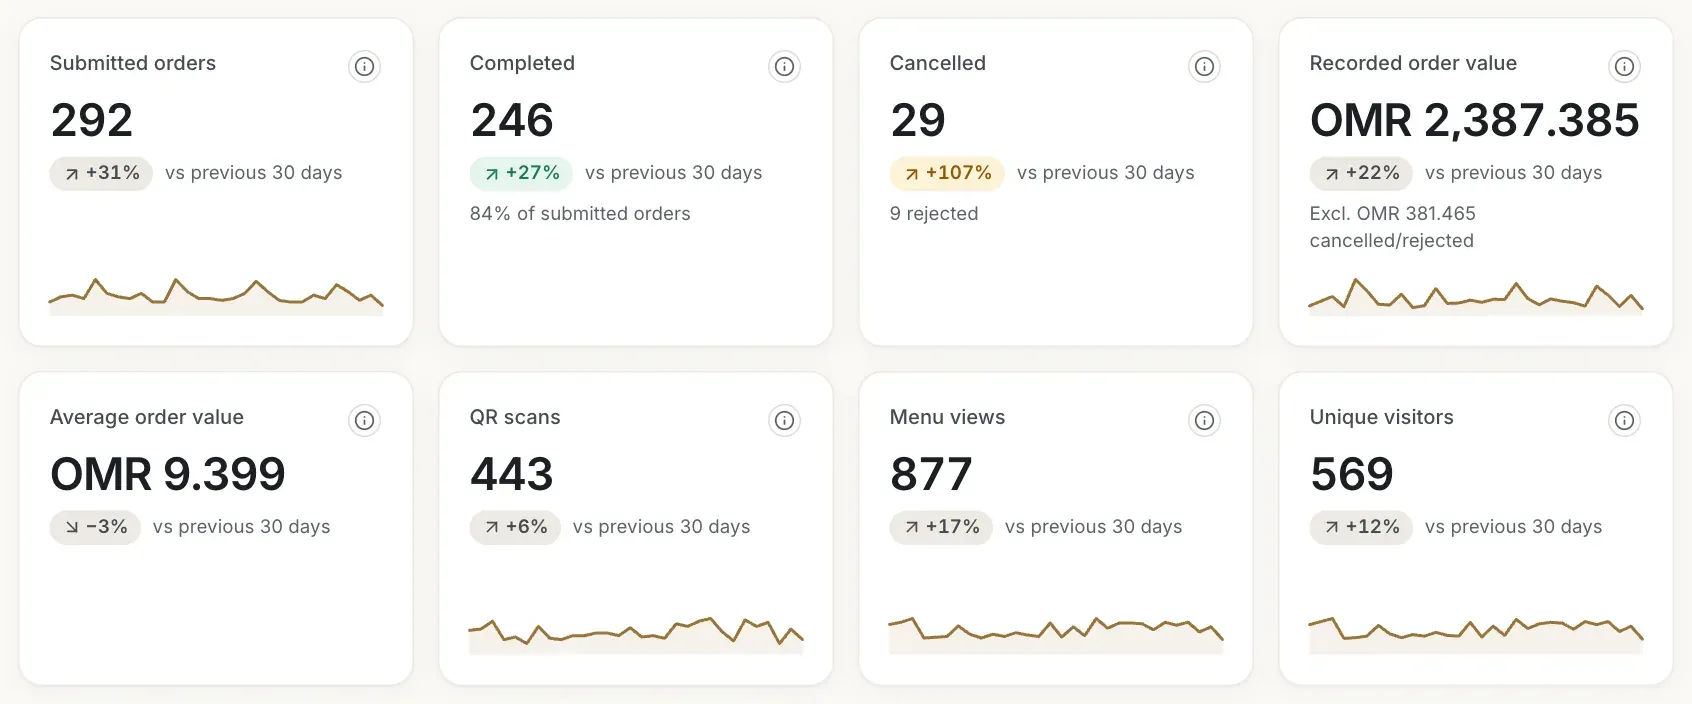
- QR scans
- Menu views
- Unique visitors
Read time on menu and orders per 100 visits
Open QR & engagement. The four figures at the top are:
- Average time on menu: the average time guests actively used the menu, for example 3 min 30 s, with the number of visits it is based on (Across 550 engaged visits). Time counts only while the page is visible and the guest touched, scrolled or typed in the last 30 seconds. A visit counts once it has at least 3 seconds of active use. One visit never counts for more than 30 minutes. Visits that closed without a final signal, for example when the phone went to sleep, are left out, so very long visits may be under-counted.
- Orders per 100 visits: submitted orders divided by menu visits, times 100. It compares two counts. It is not the share of visitors who ordered. It needs at least 30 visits, otherwise it says Needs at least 30 visits.
- Visits with an item in the cart: the share of visits in which the guest added at least one item to the cart, with the counts, for example 229 of 877 visits.
- Item favourites: how many times a guest marked a dish as a favourite, once per dish and visit.

- Average time on menu
- Orders per 100 visits
- Visits with an item in the cart
- Item favourites
Follow visits by day
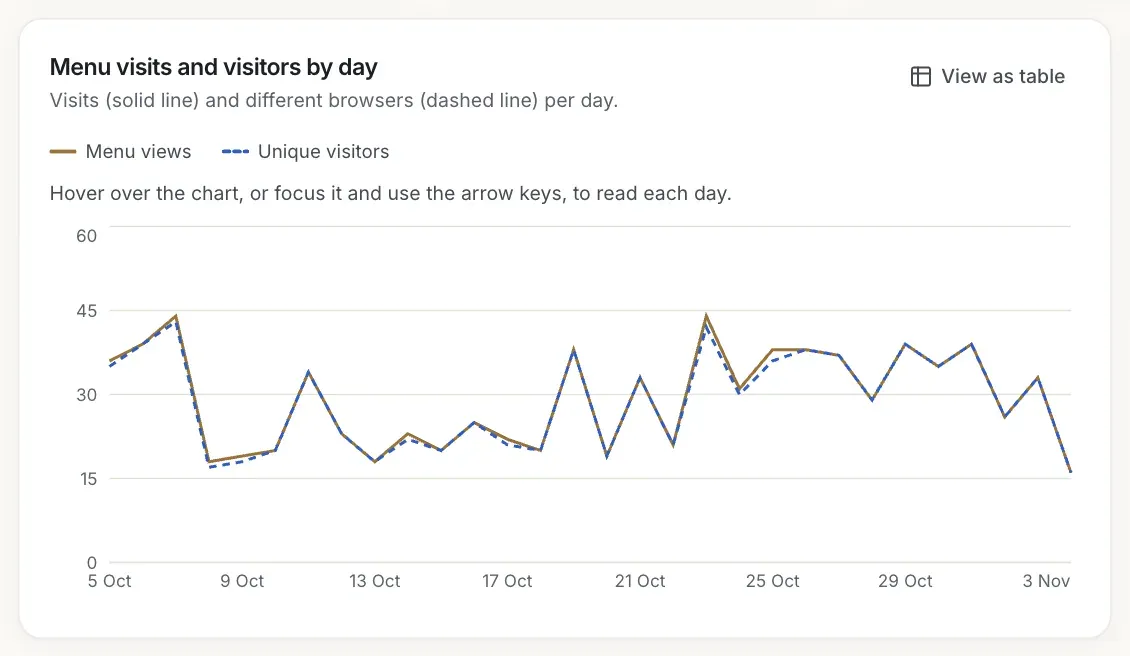
Menu visits and visitors by day draws the visits as a solid line and the visitors as a dashed line, one point per day. The two lines are close when most visitors come once. Click View as table for the numbers.
See which devices guests use
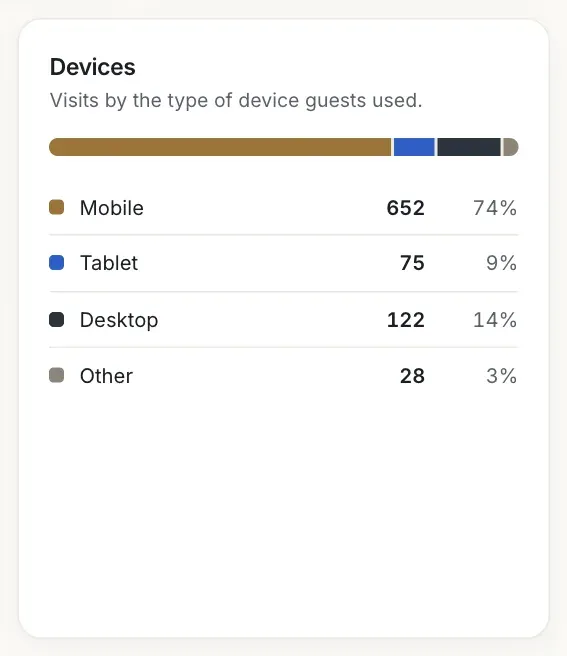
Devices splits the visits into Mobile, Tablet, Desktop and Other. The device comes from the guest's browser. It tells you how to judge the menu on a small screen, not who the guest is.
See which tables are scanned
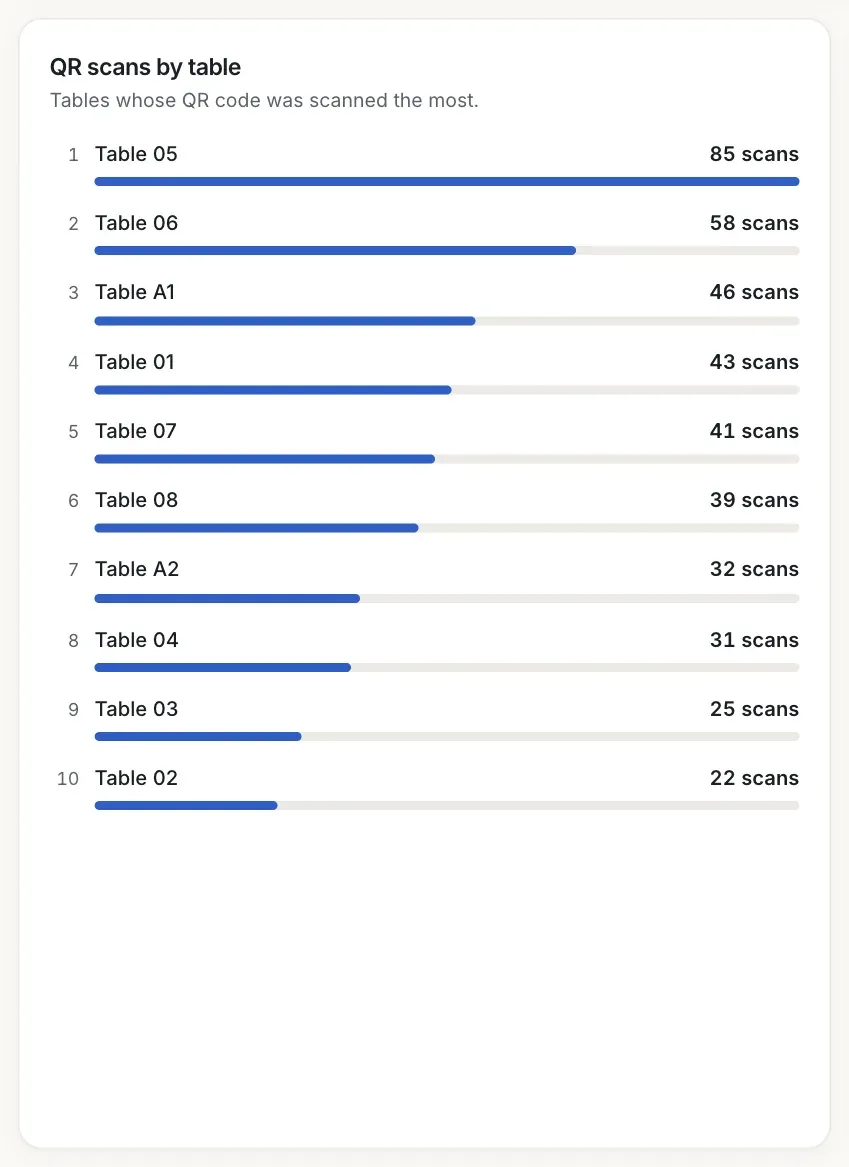
QR scans by table ranks the tables whose QR code was scanned most. Use it with Table activity in the Orders section to see tables that are scanned but do not order.
Know when counting began
Counting visits started on a certain day. When your period starts earlier, a blue notice says Visit tracking started on 24 Oct 2026 (with your date) and the visit figures cover only the days from then on. Orders are complete for the whole period. If the whole period is earlier, nothing is shown instead of a zero and the notice says Visit tracking was not active in this period. Visit data is kept for about 13 months (395 days).
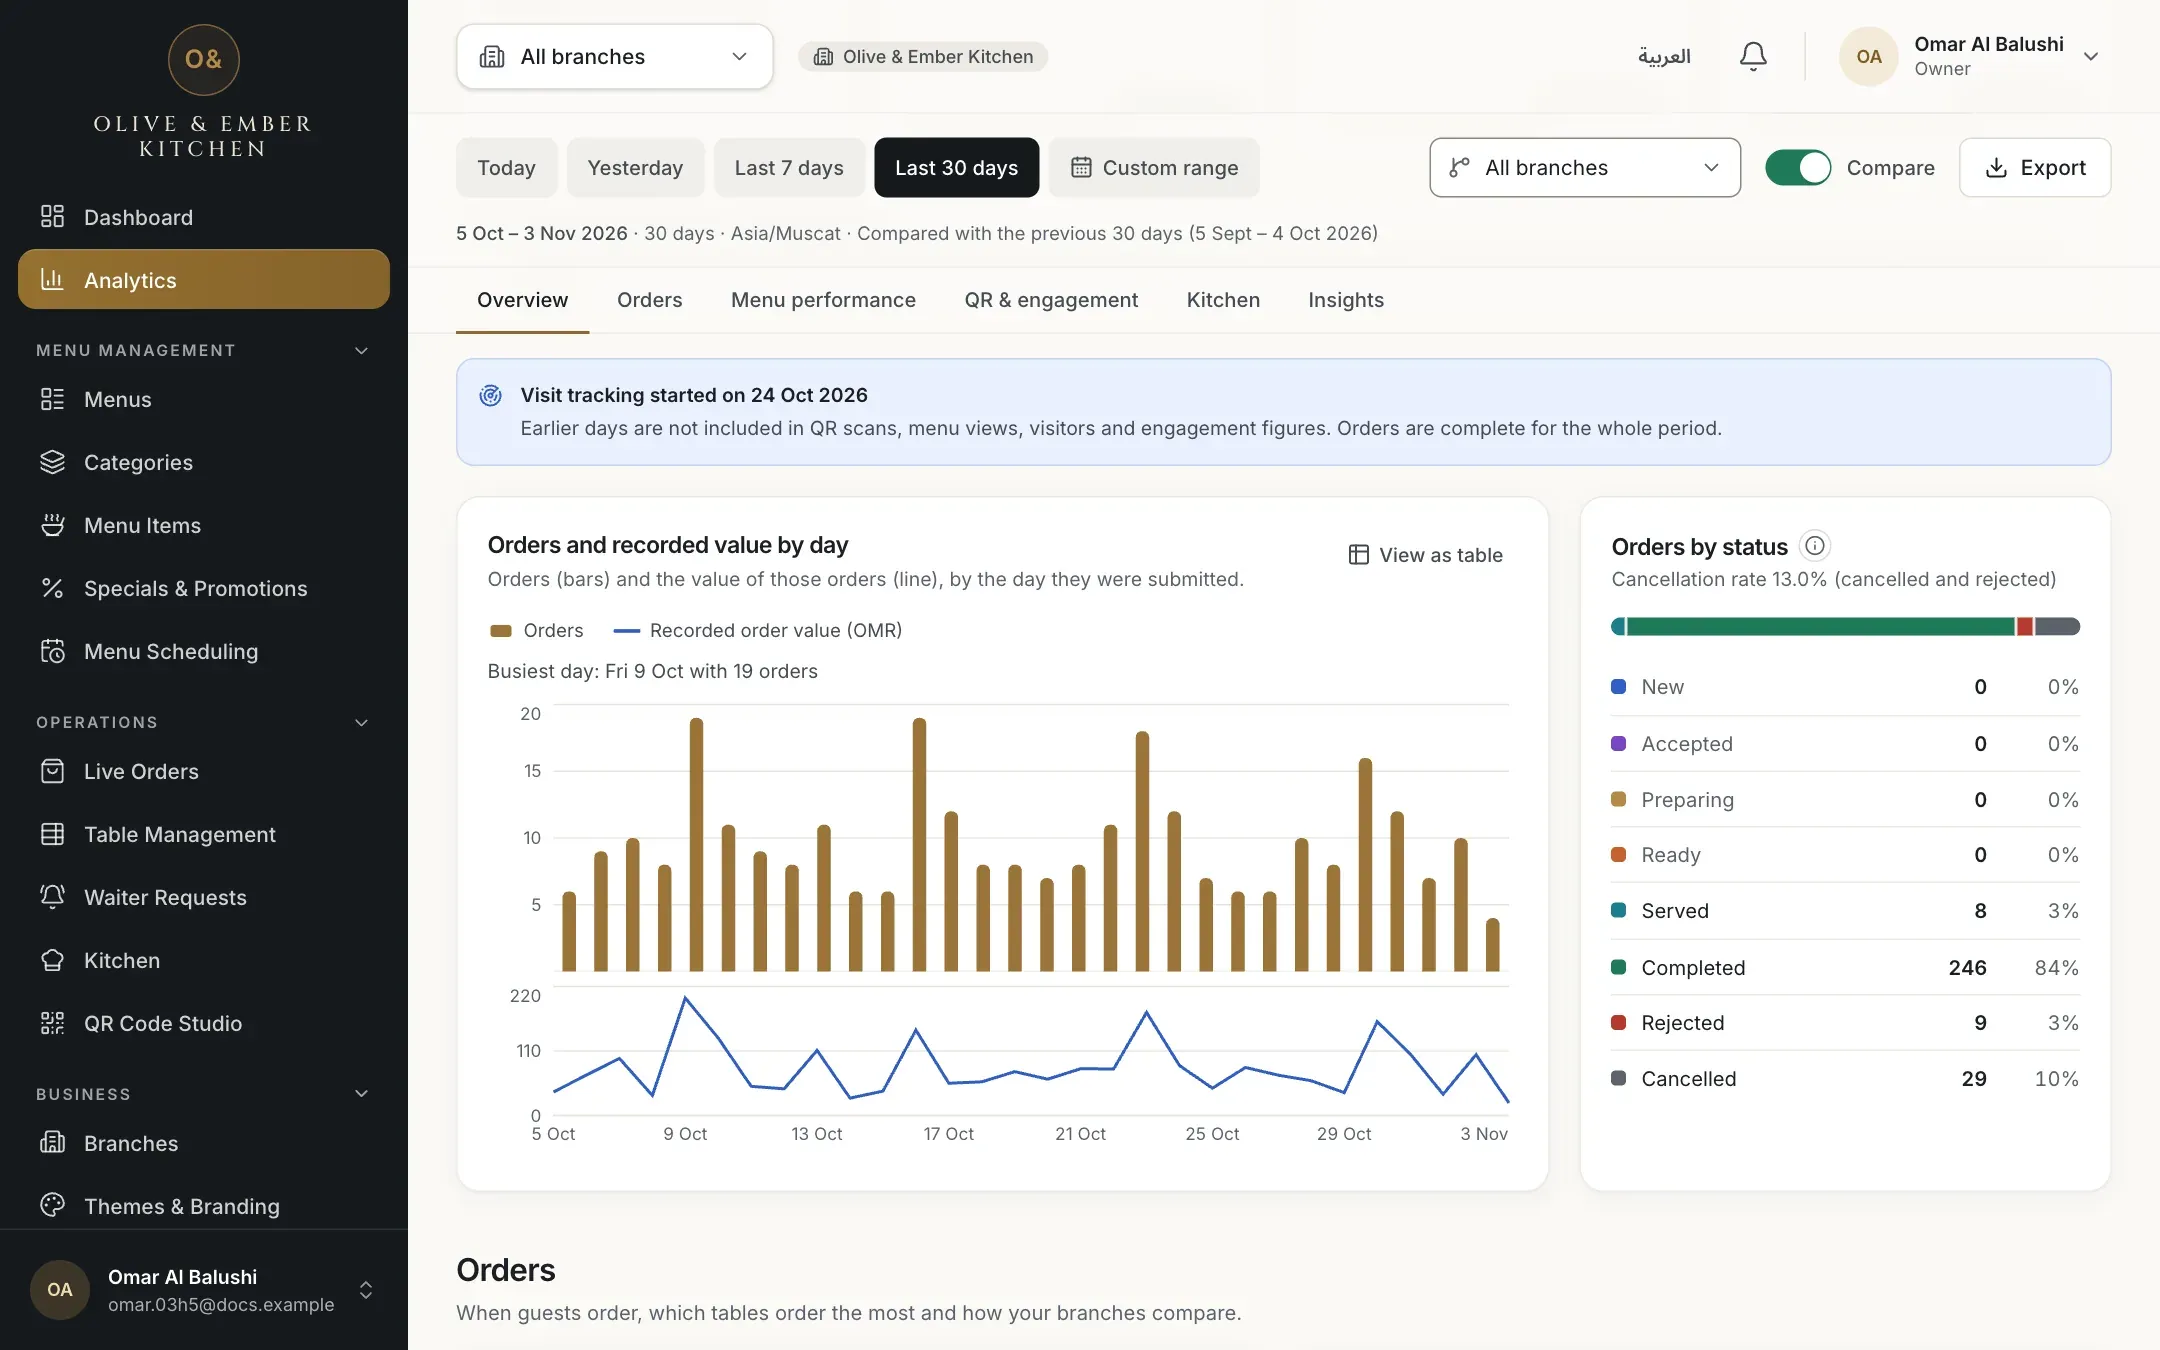
- The notice with the start date
Limits to keep in mind
Visitors are counted per browser, not per person. Time on menu can under-count visits whose last signal was lost. Bots and automated tools are ignored, but a person using a tool that hides itself may be counted. Figures exist only from the day counting began. Orders per 100 visits compares two counts and is not a conversion rate.
Troubleshooting
The period is before counting began. Choose a period from the start date shown in the message. Orders are not affected.
Average time on menu needs visits with some active use. It appears when guests have used the menu for a few seconds or more. The card says Not enough engaged visits yet until then.
Orders per 100 visits is shown only when the period has at least 30 menu visits. Choose a longer period.
Counting was on for the whole period and nothing was recorded. Check that your QR codes are active in QR Code Studio, or try a longer period.
RothDine cannot tell a test from a guest. Your own scans and visits count like anyone else's. Testing from your own phone adds one visitor per browser.
Related guides
- Analytics and insightsUnderstand your dashboard figuresRead the four visit cards, the chart and Top Categories on the Dashboard, and what each message under a figure means.
- Analytics and insightsSee which dishes performFind your most ordered dishes, compare categories and see which dishes and categories guests look at.
- Tables & QR codesCreate QR codesCreate a QR code for your restaurant, a branch or a single table, and see what a guest gets when scanning it.
- Analytics and insightsRead your insightsUnderstand each insight card: what happened, the evidence, the period, why it may matter and what you might consider.