
Open the Analytics page
Open Analytics, choose a period, a branch and the comparison, jump between sections and share the view with a colleague.
- Goal
- You open Analytics, set the period, branch and comparison you want, and know how to share that view.
- Before you start
- You are signed in to your restaurant
- Your role may view analytics (see the first steps)
The Analytics page is one long page with six sections: Overview, Orders, Menu performance, QR & engagement, Kitchen and Insights. A bar of filters stays at the top while you scroll, so every section always follows the period and branch you chose. Figures follow your restaurant's time zone, shown in the line under the filters.
Open Analytics
In the sidebar, under Dashboard, choose Analytics. The entry is shown only to roles that may view analytics: the owner, administrators, branch managers, order managers, menu editors and viewers. The View Analytics button in the Quick Actions of the Dashboard opens the same page.
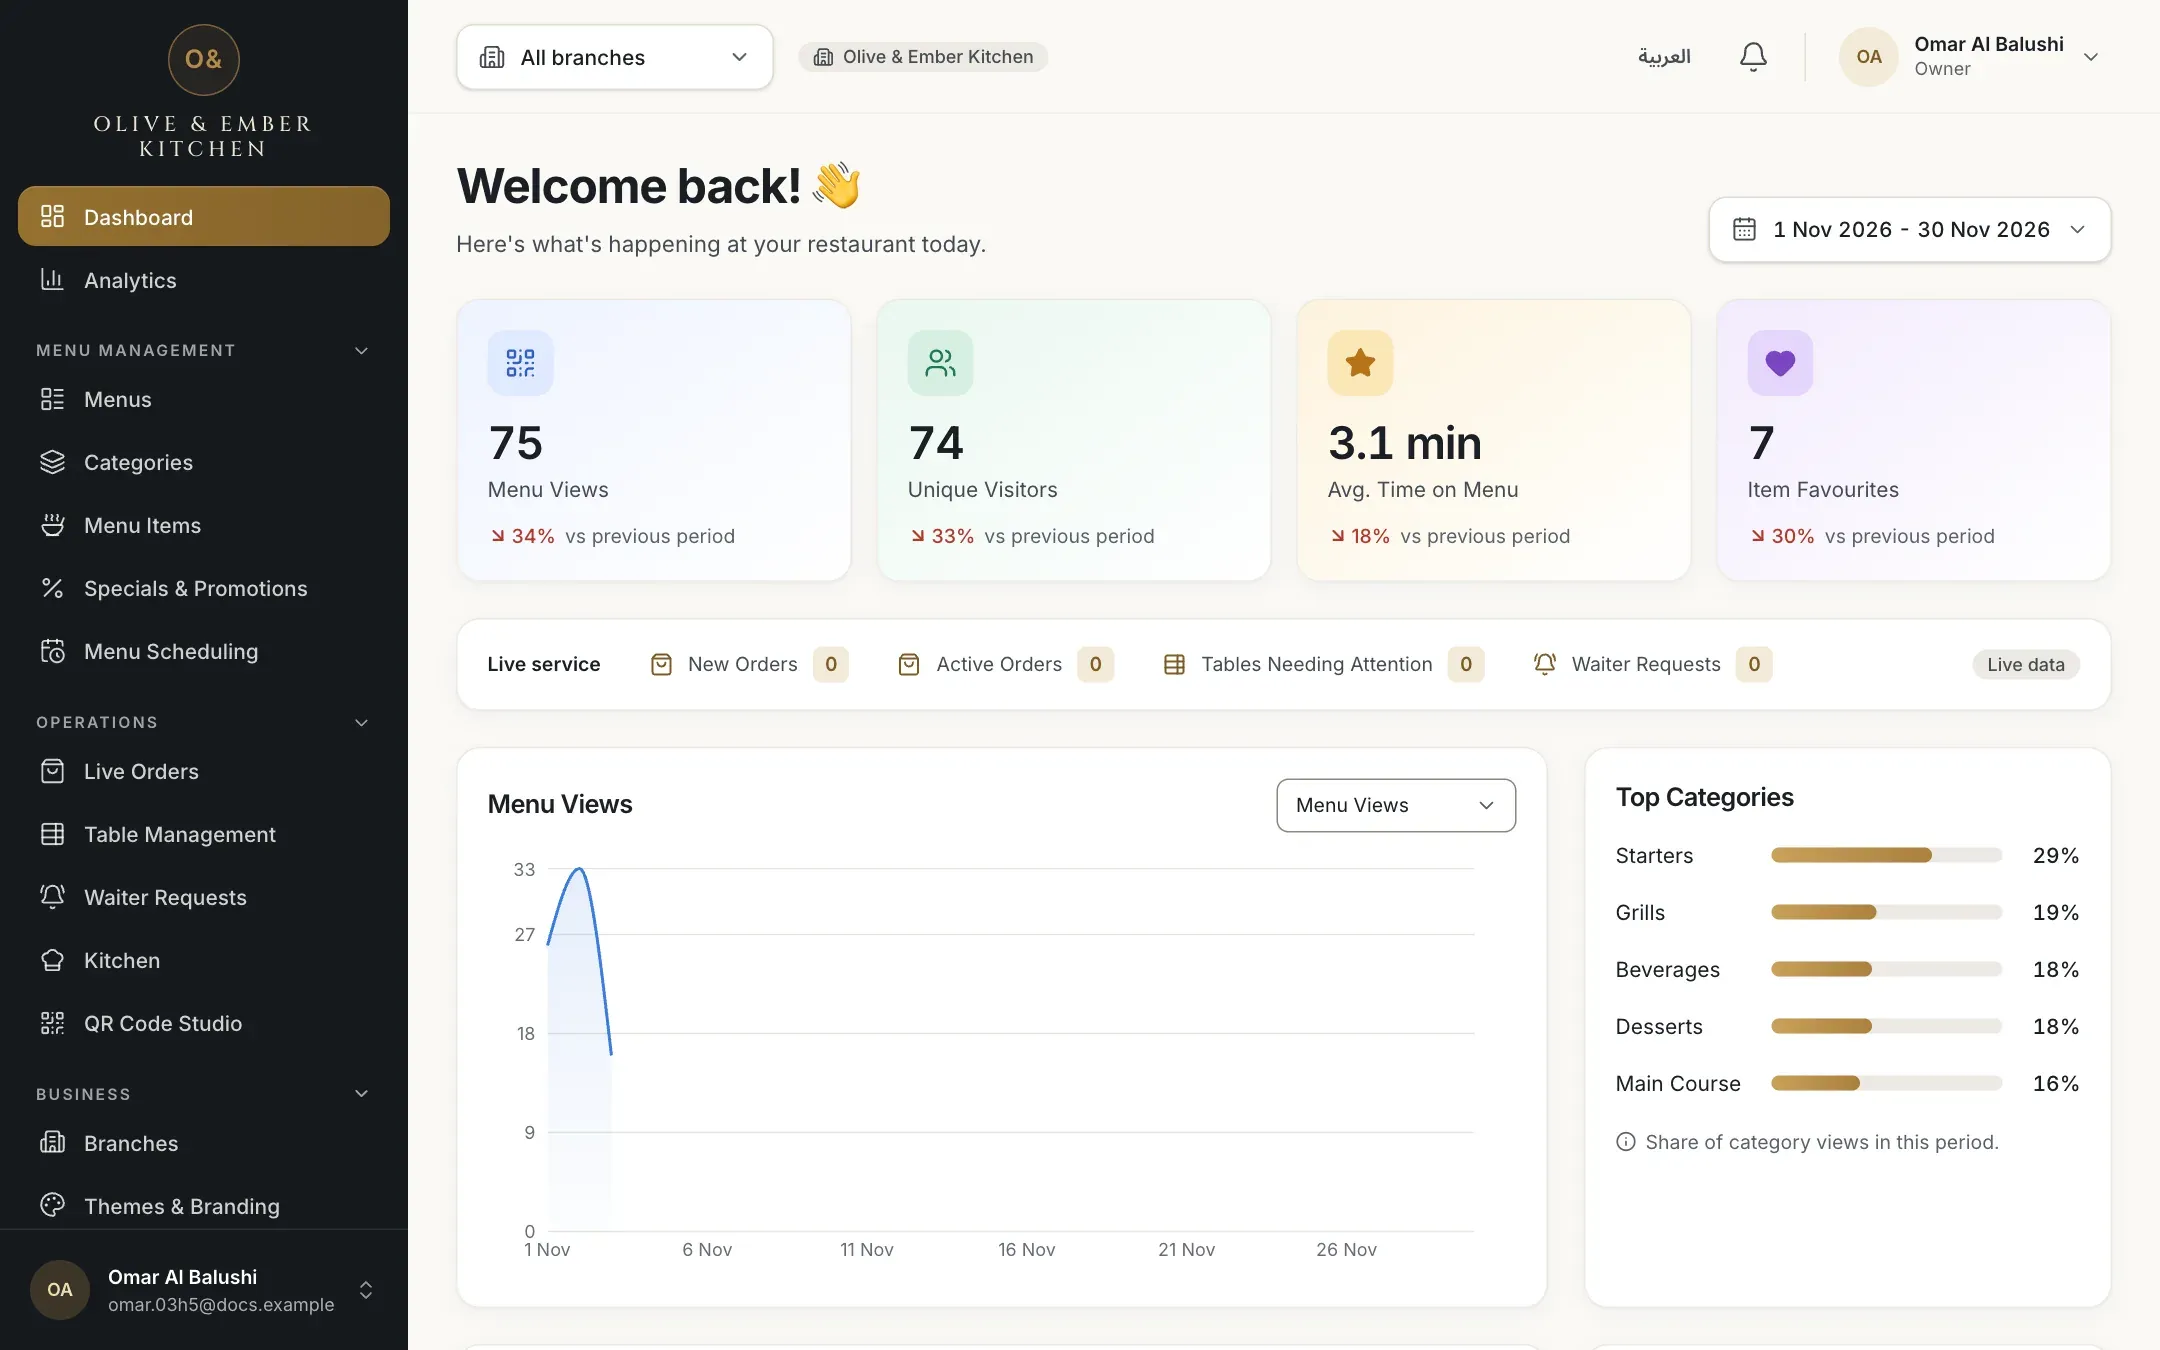
- Analytics in the sidebar
Check what your role can see
Waiters and kitchen staff do not have Analytics. A waiter who opens the page sees Analytics is not part of your role. A person with only the Kitchen staff role is sent to the kitchen board. Branch managers and order managers see only the branches they were given. If you need analytics, ask the owner to change your role (see Roles and permissions).
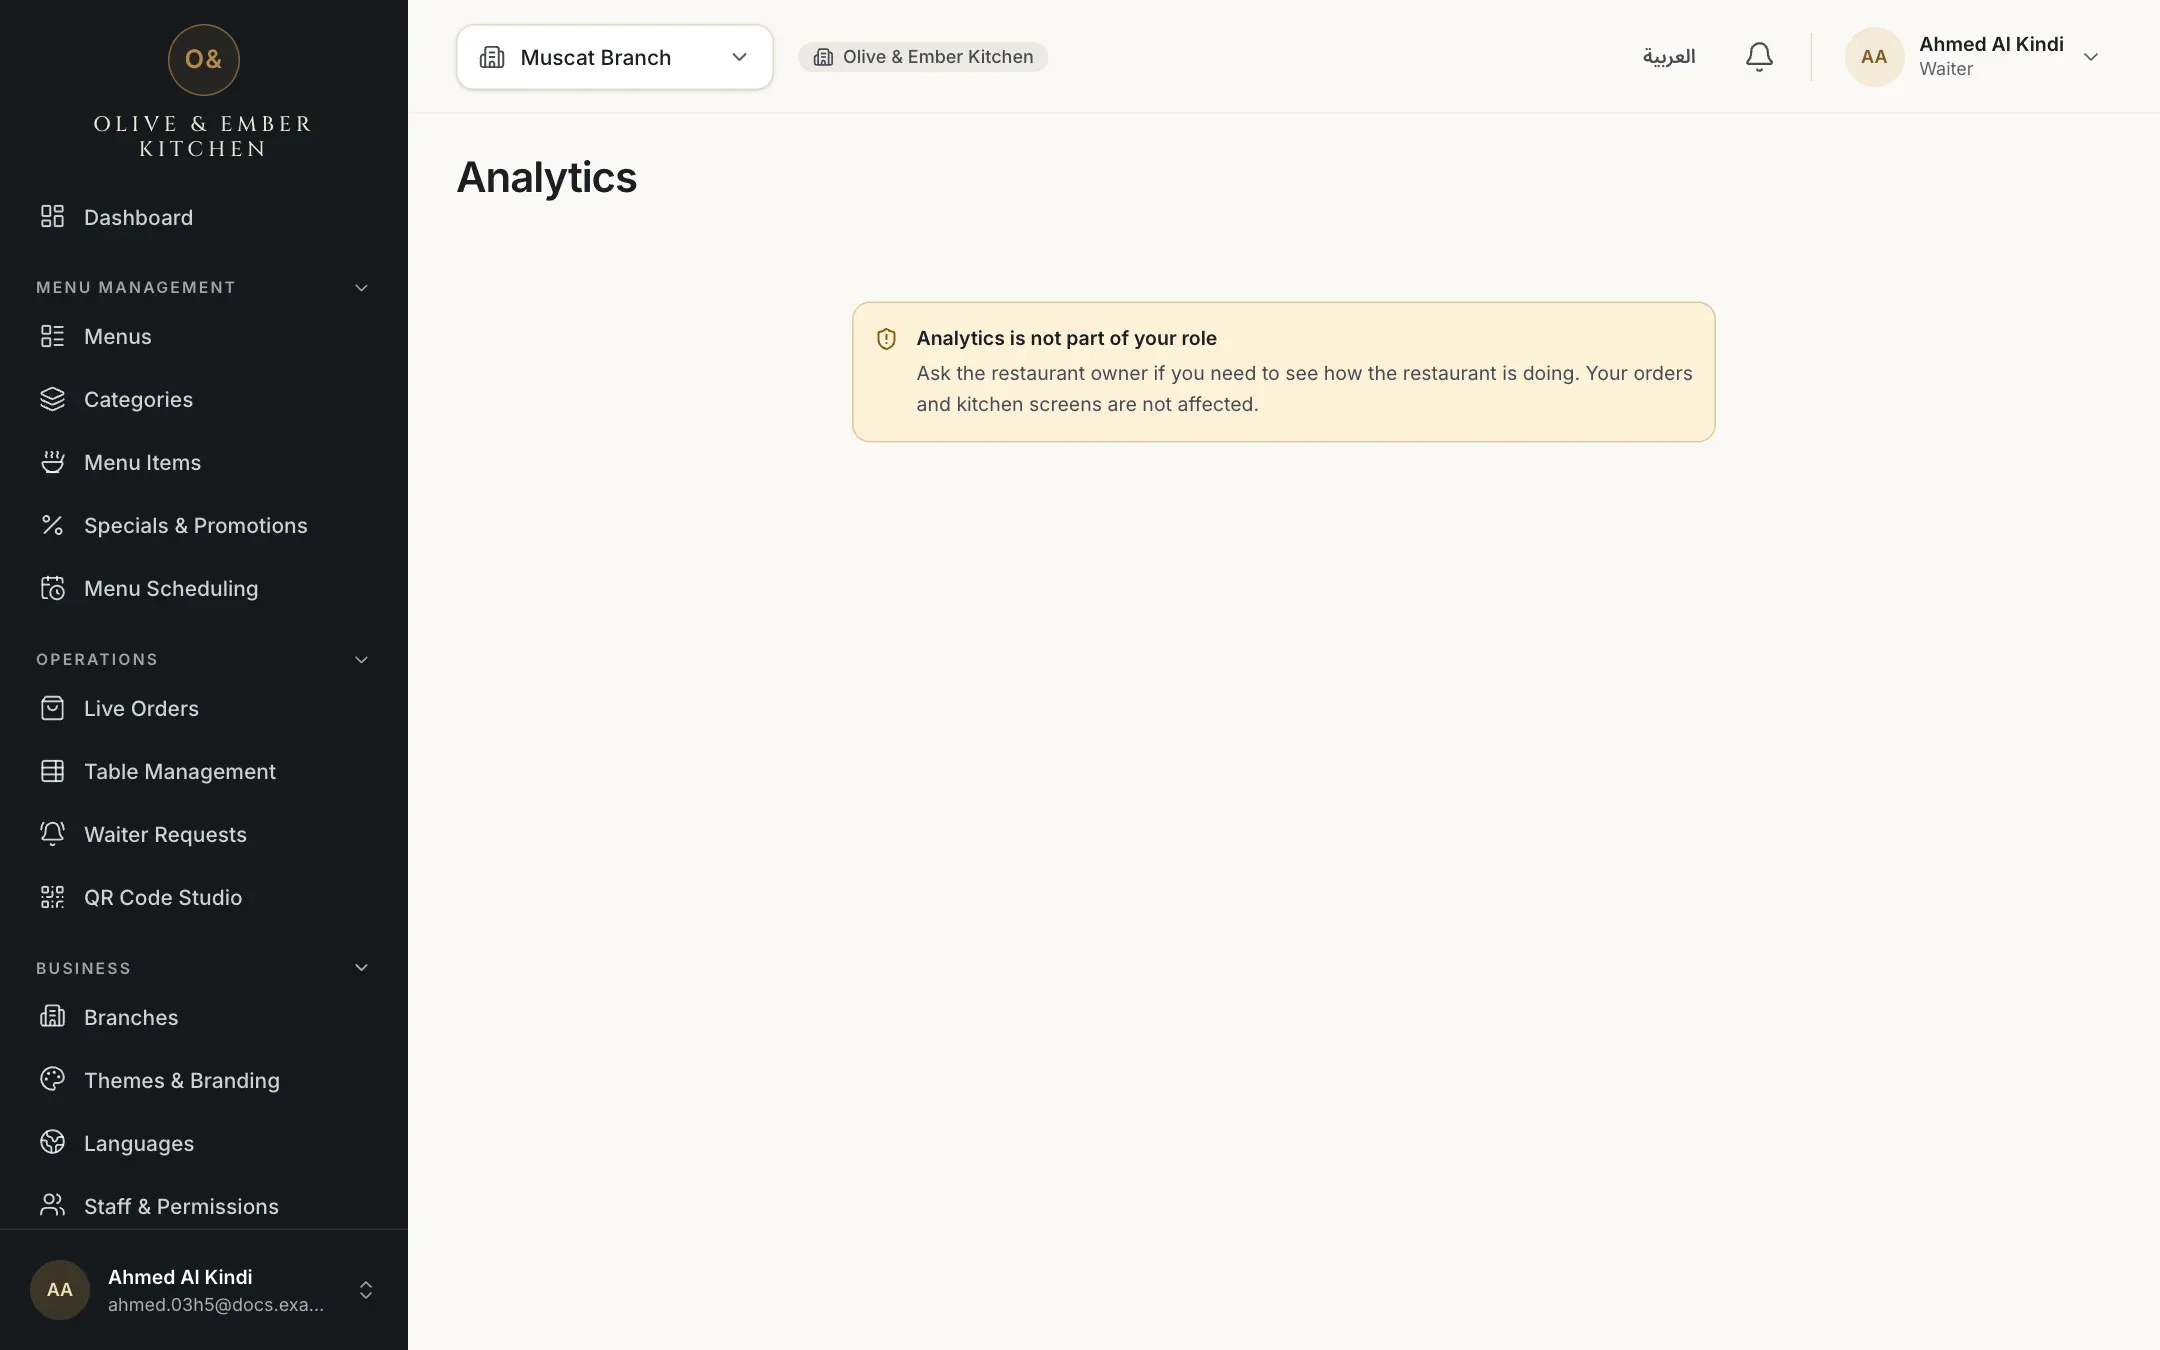
- The notice for a role without access
Choose a period
The filter bar starts with Last 30 days. Click Today, Yesterday, Last 7 days or Last 30 days to change it. A day starts and ends at midnight in your restaurant's time zone, so Today is your today, wherever you are.

- Today
- Last 30 days, the chosen period
- Custom range
Pick your own dates
Click Custom range. Click the first and then the last day in the calendar, or type the dates in From and To, then click Apply. A range can cover at most 366 days, the last day cannot be in the future, and the first day cannot come after the last. If a date is wrong the form says so, for example The first day must not be after the last day. On a phone the calendar opens below the filters and follows the button when you scroll.
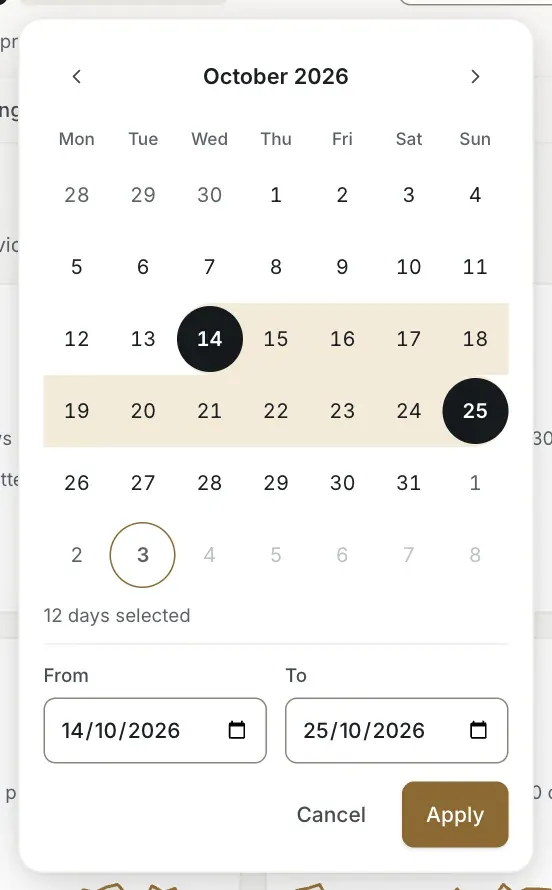
- From
- To
- Apply
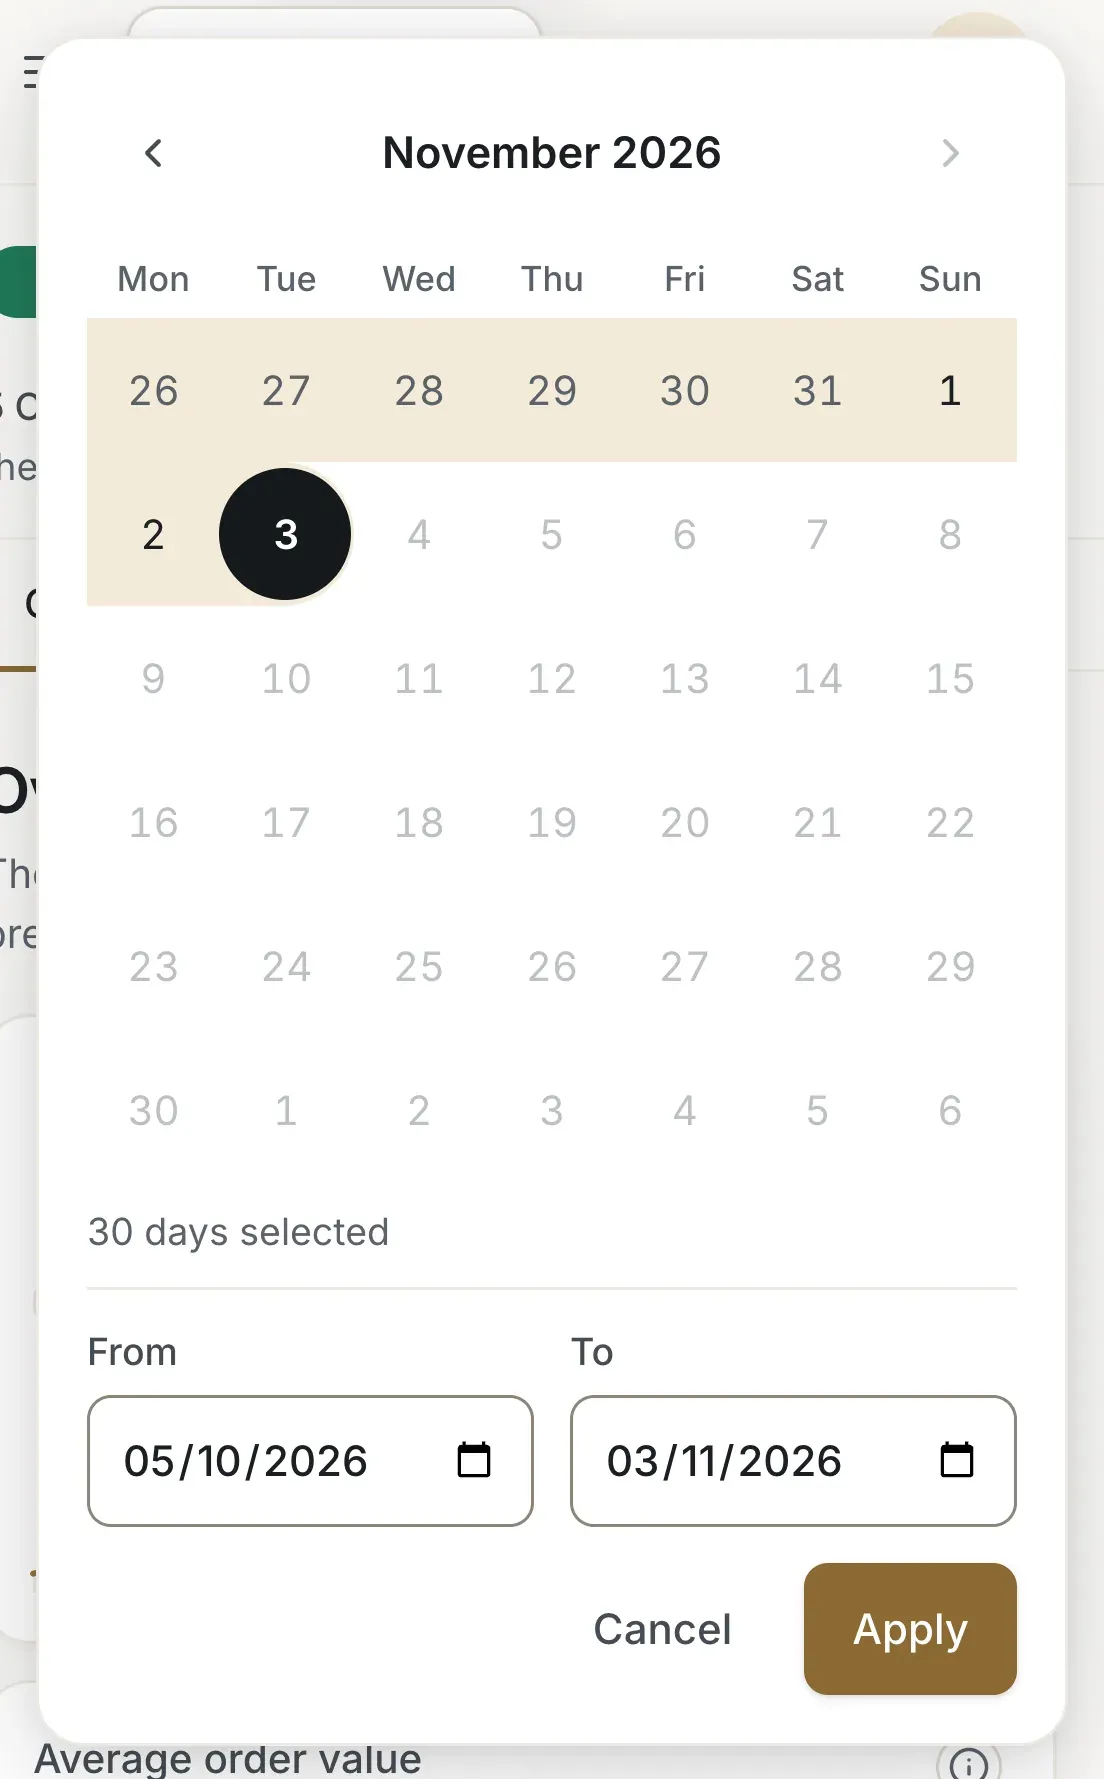
- From
- To
- Apply
Filter by branch
If you can see more than one branch, a list next to the period shows All branches. Choose one branch to see only its orders, scans, visits and kitchen times. If you have only one branch the list is not shown.

- The branch list
Turn the comparison on or off
The switch Compare is on by default. It compares every figure with the period just before yours, of the same length, and the line under the filters names that period, for example Compared with the previous 30 days. Turn it off to see the figures alone. A percentage is shown only when the earlier period has enough data. Otherwise you see No comparable previous data.

- The Compare switch
- The previous period it is compared with
Jump between sections
Under the filters, the six names Overview, Orders, Menu performance, QR & engagement, Kitchen and Insights take you to that part of the page. The bar stays in view while you scroll and marks the section you are reading.
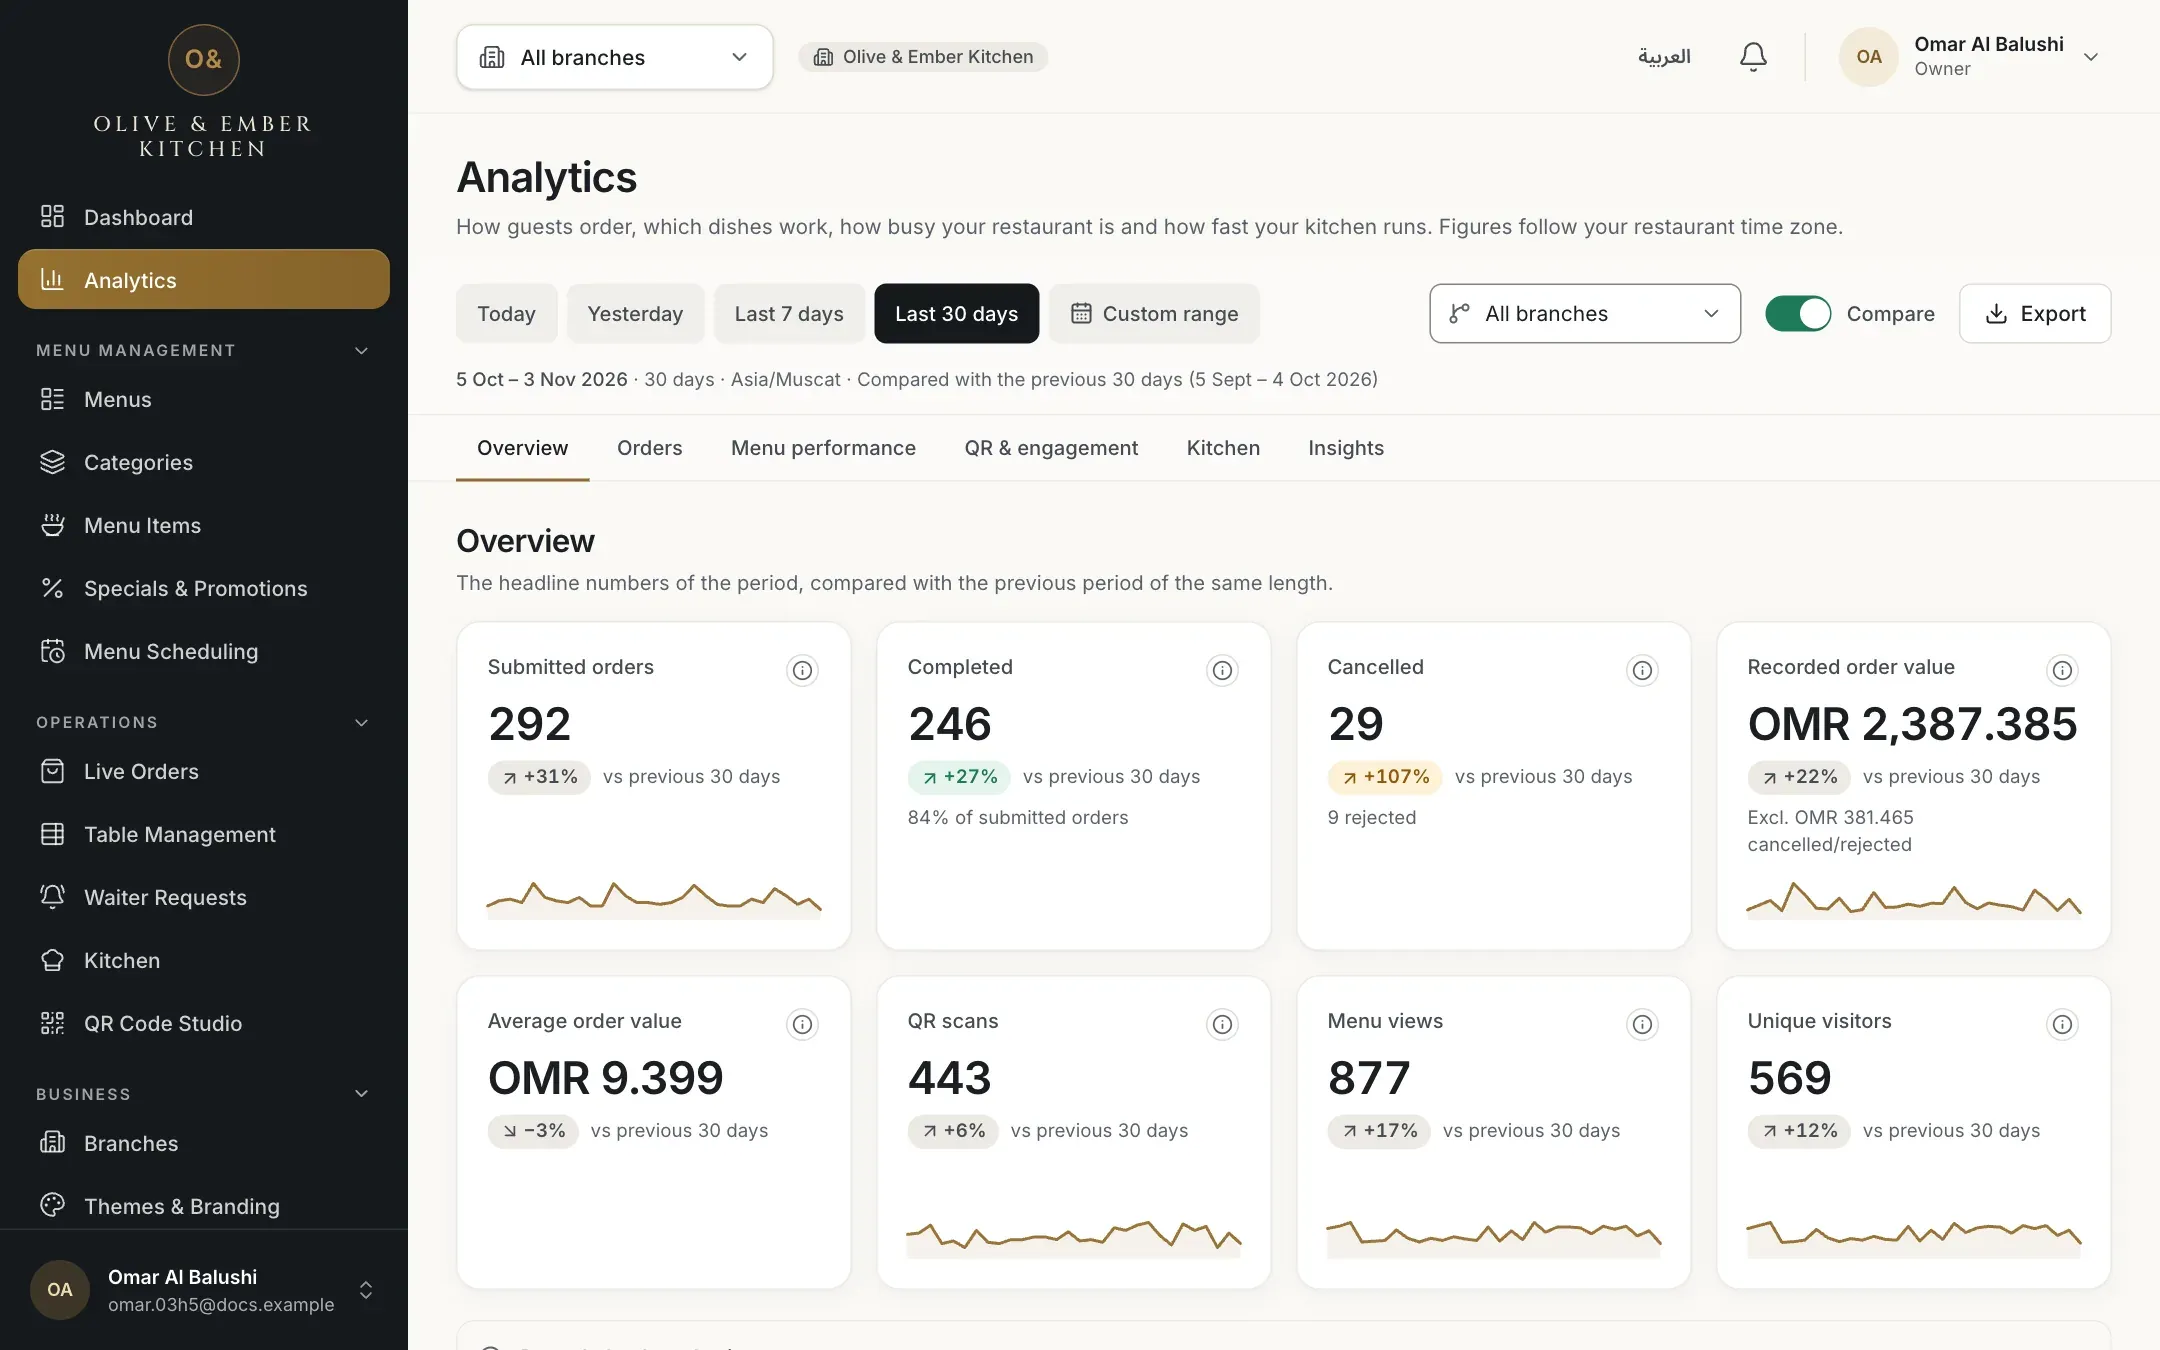
- The six sections
Share the view
There is no share button, but the address of the page holds your choices: the period, the branch and whether Compare is on. Copy the address from your browser and send it to a colleague. They must sign in and have access to analytics for that restaurant. A period such as Last 7 days stays relative, so the link always shows the most recent 7 days. A custom range keeps its exact dates. If the link names a branch the person cannot see, the page shows all of their branches instead.

- The line that names the dates, the days and the time zone
- The branch in the view
Troubleshooting
Your role does not include analytics. Waiters and kitchen staff never have it. Ask the owner if you need to see how the restaurant is doing. Your orders and kitchen screens are not affected.
The From date is later than the To date. Swap them, or pick the days again in the calendar.
Choose a shorter range. You can look at a longer time by choosing several ranges one after another.
Choose today or an earlier day as the last day.
Something went wrong on our side or your connection dropped. Nothing has been lost. Click Try again. If the figures were already on screen, a notice says the latest refresh failed and you are looking at the previous figures.
This message appears only on an environment that has not been updated for analytics. Your orders and menu are not affected. Write to support@rothdine.com if you see it on your live account.
Related guides
- Analytics and insightsUnderstand your dashboard figuresRead the four visit cards, the chart and Top Categories on the Dashboard, and what each message under a figure means.
- Analytics and insightsRead your order analyticsSee how many orders you receive, when, from which tables, their recorded value, average order value and cancellation rate.
- Team & permissionsRoles and permissionsCompare the eight roles in RothDine and read the permissions matrix that shows what each role can do.
- Analytics and insightsExport analytics as CSVDownload seven CSV files for the period and branch you chose, and open them in Excel or Google Sheets, also in Arabic.