
Export analytics as CSV
Download seven CSV files for the period and branch you chose, and open them in Excel or Google Sheets, also in Arabic.
- Goal
- You download a CSV file of the analytics you need and open it in Excel or Google Sheets.
- Before you start
- Your role may view analytics
- The Analytics page is open and its figures have loaded
Exports are plain tables of totals that you can open in a spreadsheet, filter or share with your accountant. Every file follows the period and the branch you chose in the filters. They contain totals only: no guest names, notes, phone numbers, sessions or visitor codes.
Choose the period and the branch
Set the period and, if you have several branches, the branch in the filter bar first. The export uses exactly what the filters show.

- The period
- The branch
Open the Export menu and choose a file
Click Export. The menu Download as CSV lists seven files: Orders and value by day, Orders by hour, Dishes, Categories, Tables, Kitchen timings and QR and menu visits. Click one. The button stays grey until the figures have loaded.
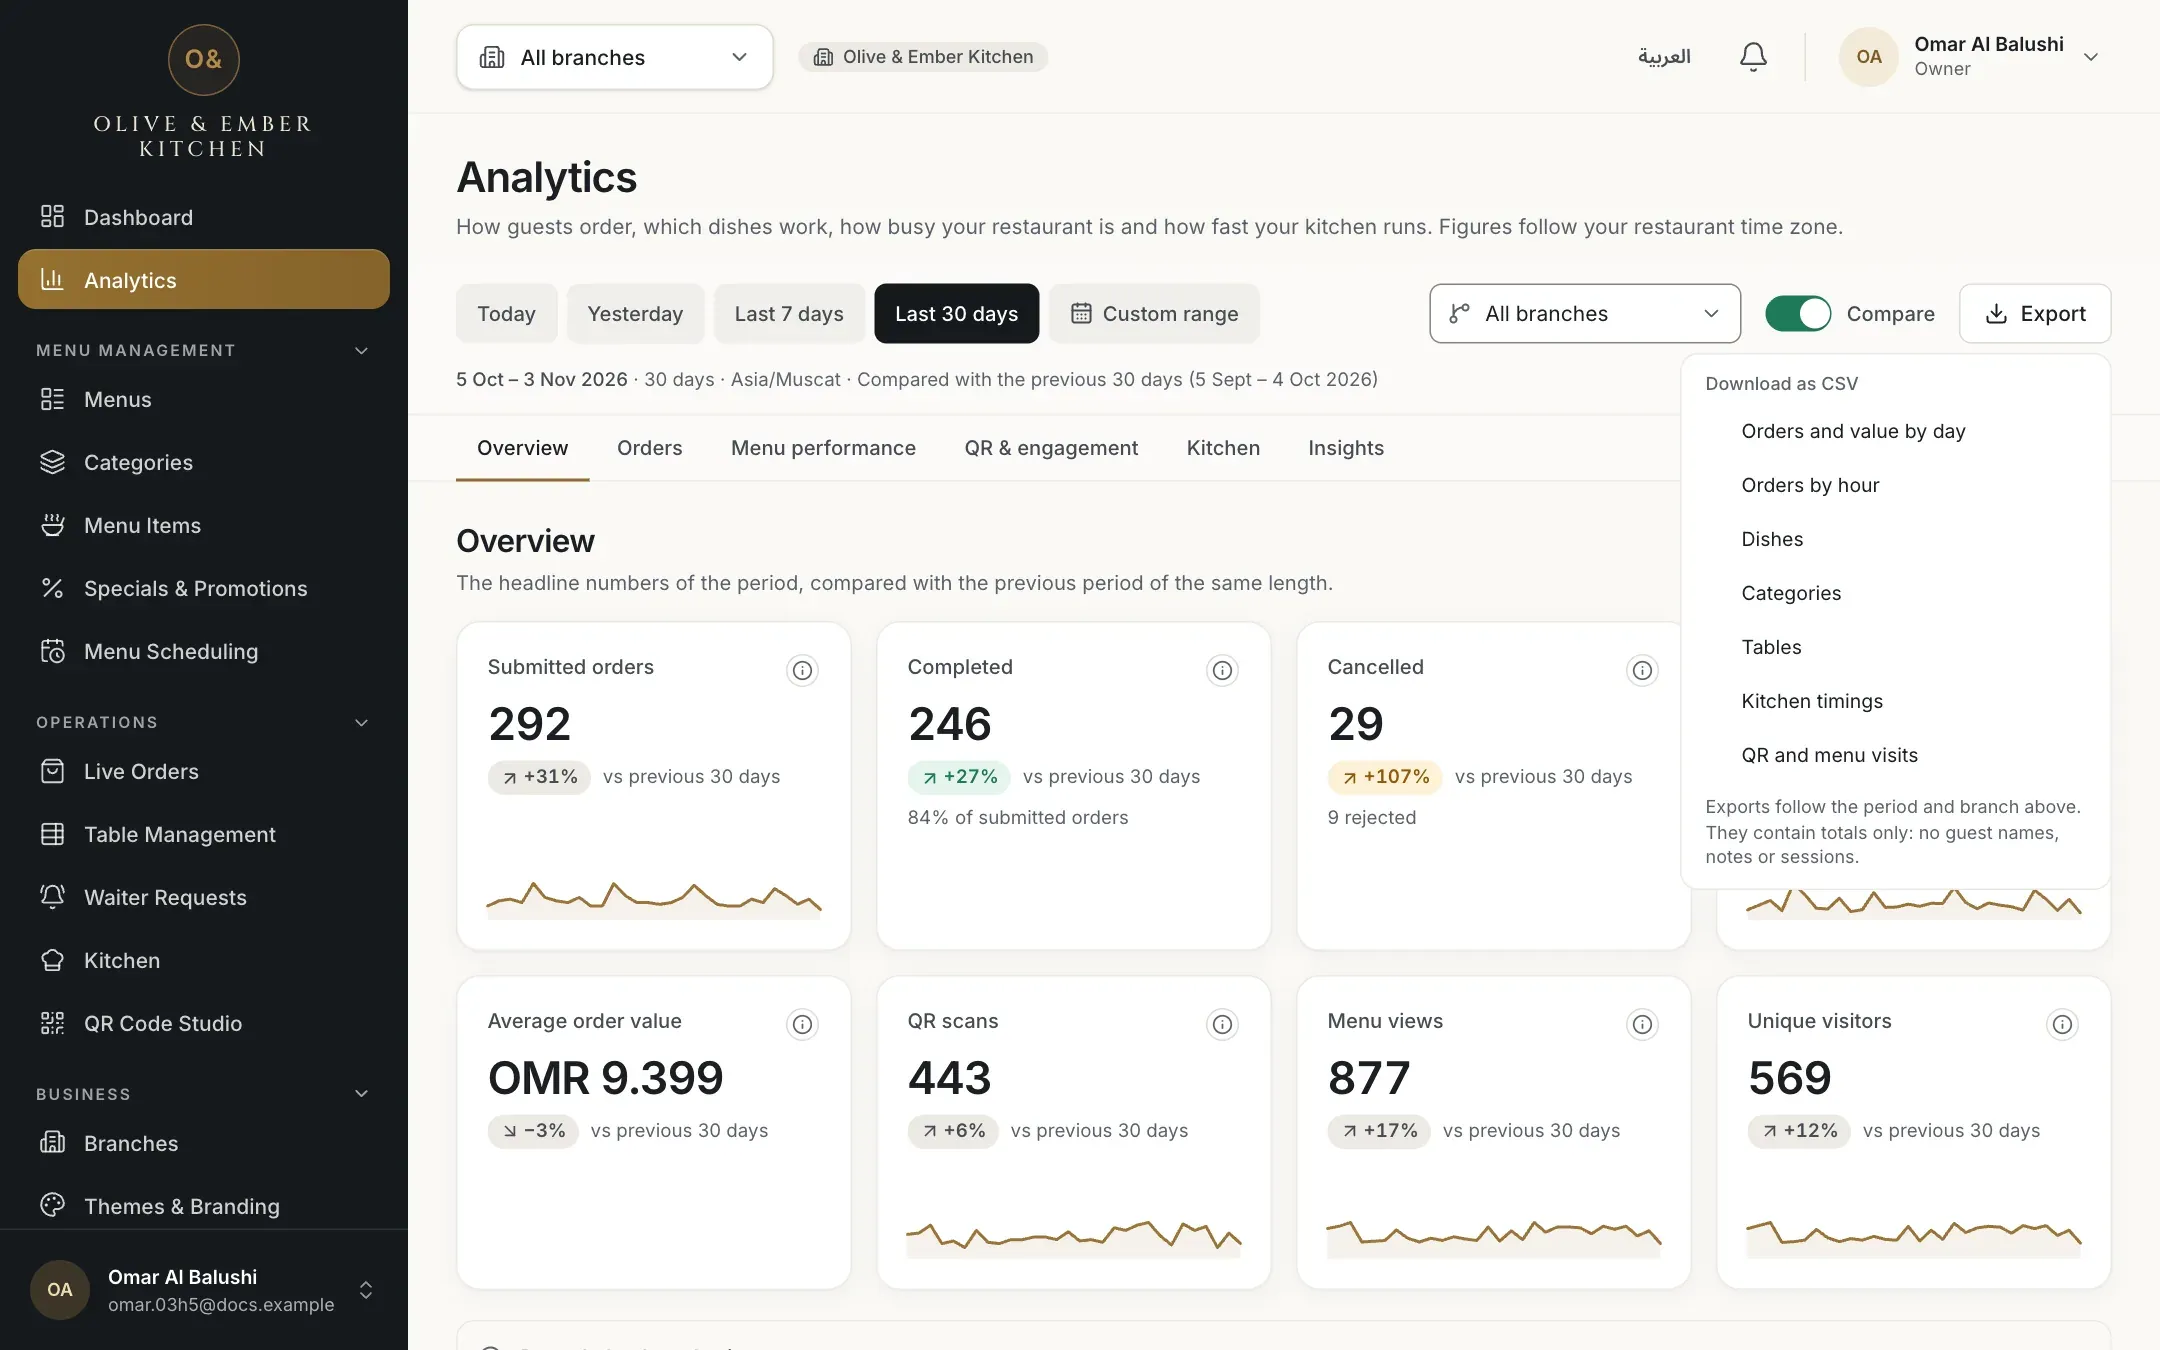
- The Export button
- The seven files
Find the downloaded file
Your browser saves the file and RothDine confirms it with Downloaded and the file name, for example rothdine-orders_by_day-2026-10-05_2026-11-03.csv. The name holds the file type and the first and last day.
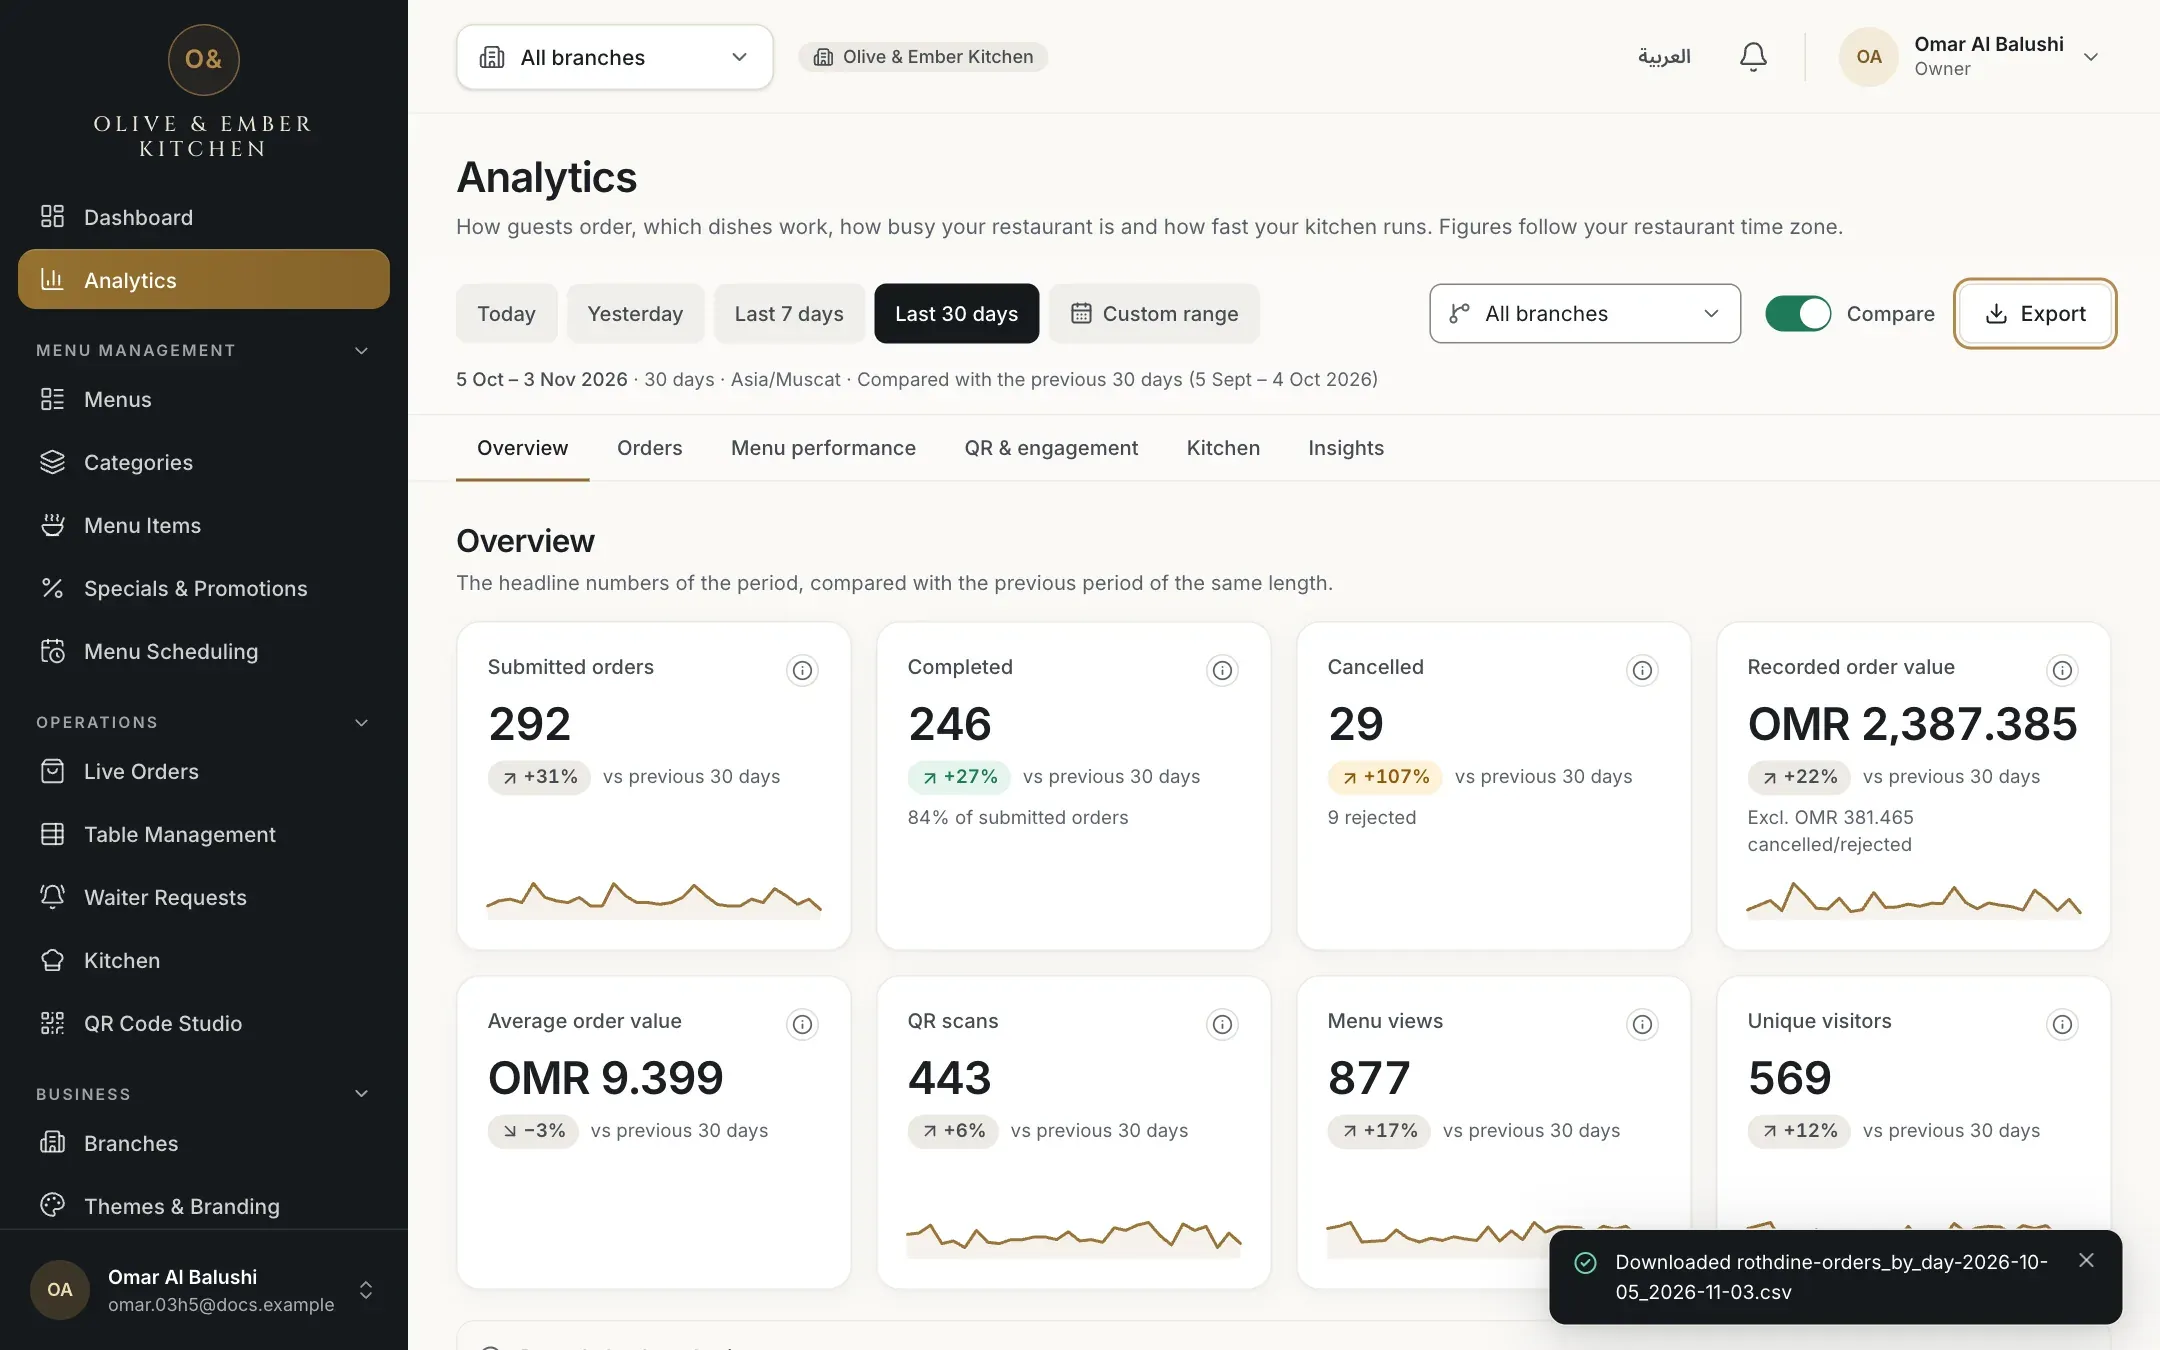
- The confirmation with the file name
Open it in Excel or Google Sheets
In Excel, double-click the file, or use Data then From Text/CSV and choose UTF-8. In Google Sheets choose File then Import and upload it. The file is saved as UTF-8 with a mark that tells Excel the text encoding, so Arabic dish and category names show correctly. If you still see strange characters, import it with UTF-8 selected. Columns are separated by commas.
Know the limits
Each file has one row of column titles and then the data, with no totals row. A file holds at most 5,000 rows, and the Dishes file at most 500. If a file was cut, the page says The export is limited to the first 5,000 rows. Choose a shorter period for the rest. Money columns show amounts in OMR with three decimals, such as 12.500, and they are recorded order value, not payments. Column titles are always in English, while dish and category names follow the language of your dashboard. A text value that starts with a symbol such as = gets a leading apostrophe on purpose, so a spreadsheet never runs it as a formula.
What each file contains
| File | Columns |
|---|---|
| Orders and value by day | Date, Orders, Completed, Cancelled, Rejected, In progress, Recorded order value (OMR), Cancelled and rejected value (OMR), Average order value (OMR). One row per day, days without orders included. |
| Orders by hour | Hour, Orders, Recorded order value (OMR). The hour is 0 to 23. |
| Dishes | Dish, Units, Recorded order value (OMR). Orders that were not cancelled or rejected. |
| Categories | Category, Units, Recorded order value (OMR), Views. Dishes without a current category are grouped as "Other (not on the current menu)". |
| Tables | Table, Orders, Recorded order value (OMR), QR scans. The table code and its orders. |
| Kitchen timings | Stage, Orders timed, Average seconds, Median seconds, P90 seconds, Delayed orders. One row for each stage of the service flow. |
| QR and menu visits | Date, Views, Visitors, QR scans, Favourites. Only days from the day counting began. |
Troubleshooting
The file could not be prepared. Check your connection and click the file again. If it keeps failing, choose a shorter period.
Only roles that may view analytics can export. Waiters and kitchen staff cannot. Ask the owner.
The file was cut at the row limit. Export shorter periods, for example one month at a time, and put them together in your spreadsheet.
Your program opened the file with the wrong encoding. In Excel use Data, From Text/CSV and choose UTF-8. In Google Sheets use File, Import.
The figures have not loaded yet, or the page shows an error. Wait for the figures, or click Try again.
Related guides
- Analytics and insightsOpen the Analytics pageOpen Analytics, choose a period, a branch and the comparison, jump between sections and share the view with a colleague.
- Analytics and insightsRead your order analyticsSee how many orders you receive, when, from which tables, their recorded value, average order value and cancellation rate.
- Analytics and insightsSee which dishes performFind your most ordered dishes, compare categories and see which dishes and categories guests look at.
- Team & permissionsRoles and permissionsCompare the eight roles in RothDine and read the permissions matrix that shows what each role can do.