
Read your order analytics
See how many orders you receive, when, from which tables, their recorded value, average order value and cancellation rate.
- Goal
- You can read orders by day, hour and status, the recorded order value, the average order value and the cancellation rate.
- Before you start
- Your role may view analytics
- Some orders from guests (Full table ordering, see Operating modes)
Order figures come from the orders guests submitted. Each order is counted once, on the day and hour it was submitted in your restaurant's time zone, and in the status it has now. An order sent yesterday and cancelled today counts as a cancelled order of yesterday.
Recorded order value is not payments
RothDine does not collect money from guests. Recorded order value is the total of the orders guests submitted, exactly as they saw it when ordering, including service charge and tax. It excludes cancelled and rejected orders. It says what guests ordered, not what they paid, and it is not revenue or profit.
Read the order cards
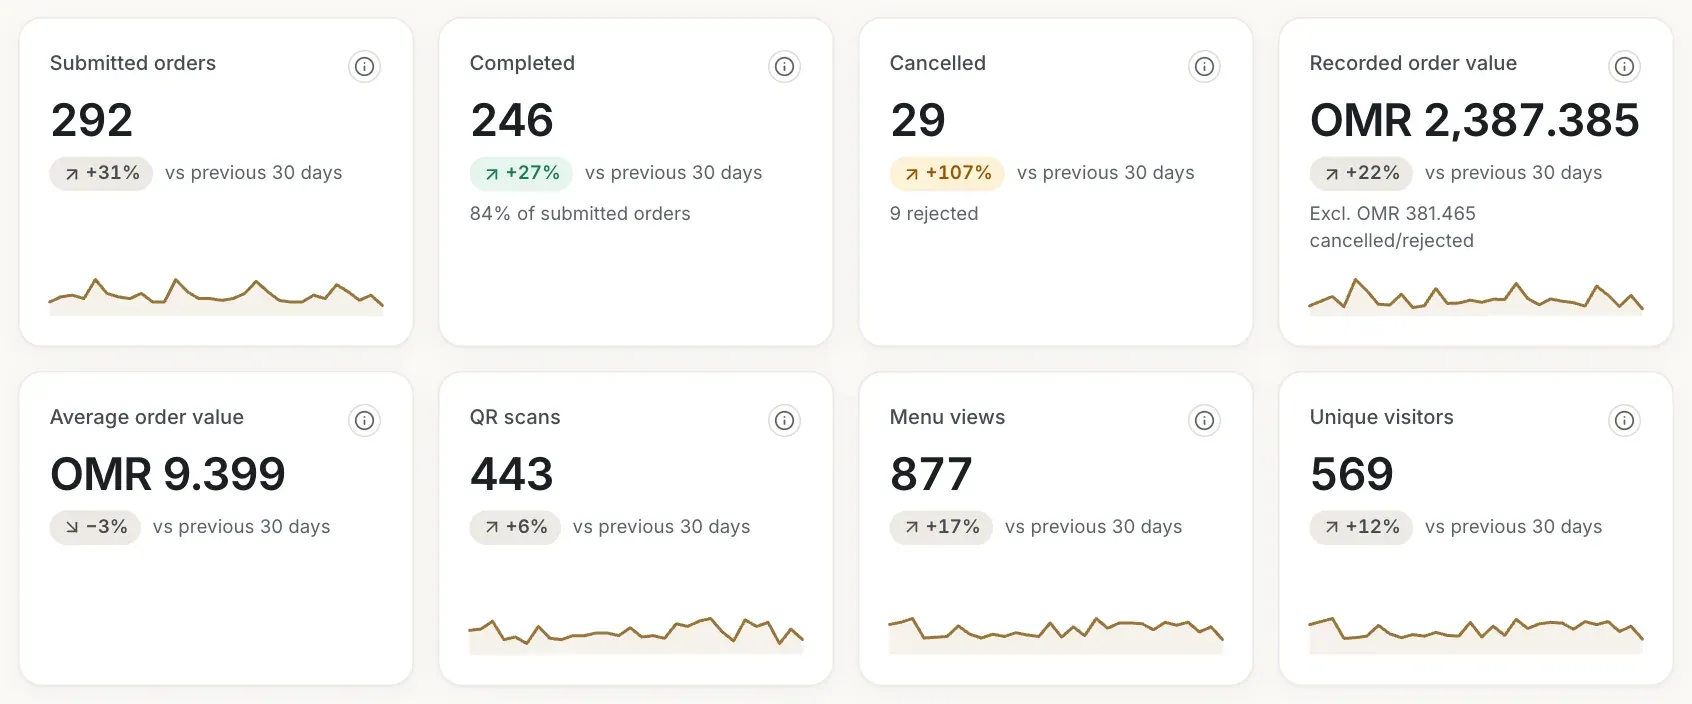
In Overview the first cards describe your orders:
- Submitted orders: every order guests sent in the period.
- Completed: orders whose status is Completed, with their share of the submitted orders. An order that is only Served is not counted here.
- Cancelled: cancelled orders. Orders refused by the restaurant are counted apart and shown under the figure, for example 9 rejected.
- Recorded order value: the sum of the orders that were not cancelled or rejected. Orders still open count. The line Excl. OMR 381.465 cancelled/rejected shows the value that was left out.
- Average order value: the recorded order value divided by the number of orders that were not cancelled or rejected. With no such orders it shows a dash and No orders to average.
When Compare is on, a badge shows the change against the previous period.
- Submitted orders
- Completed
- Cancelled
- Recorded order value
- Average order value
Open the definition of a figure
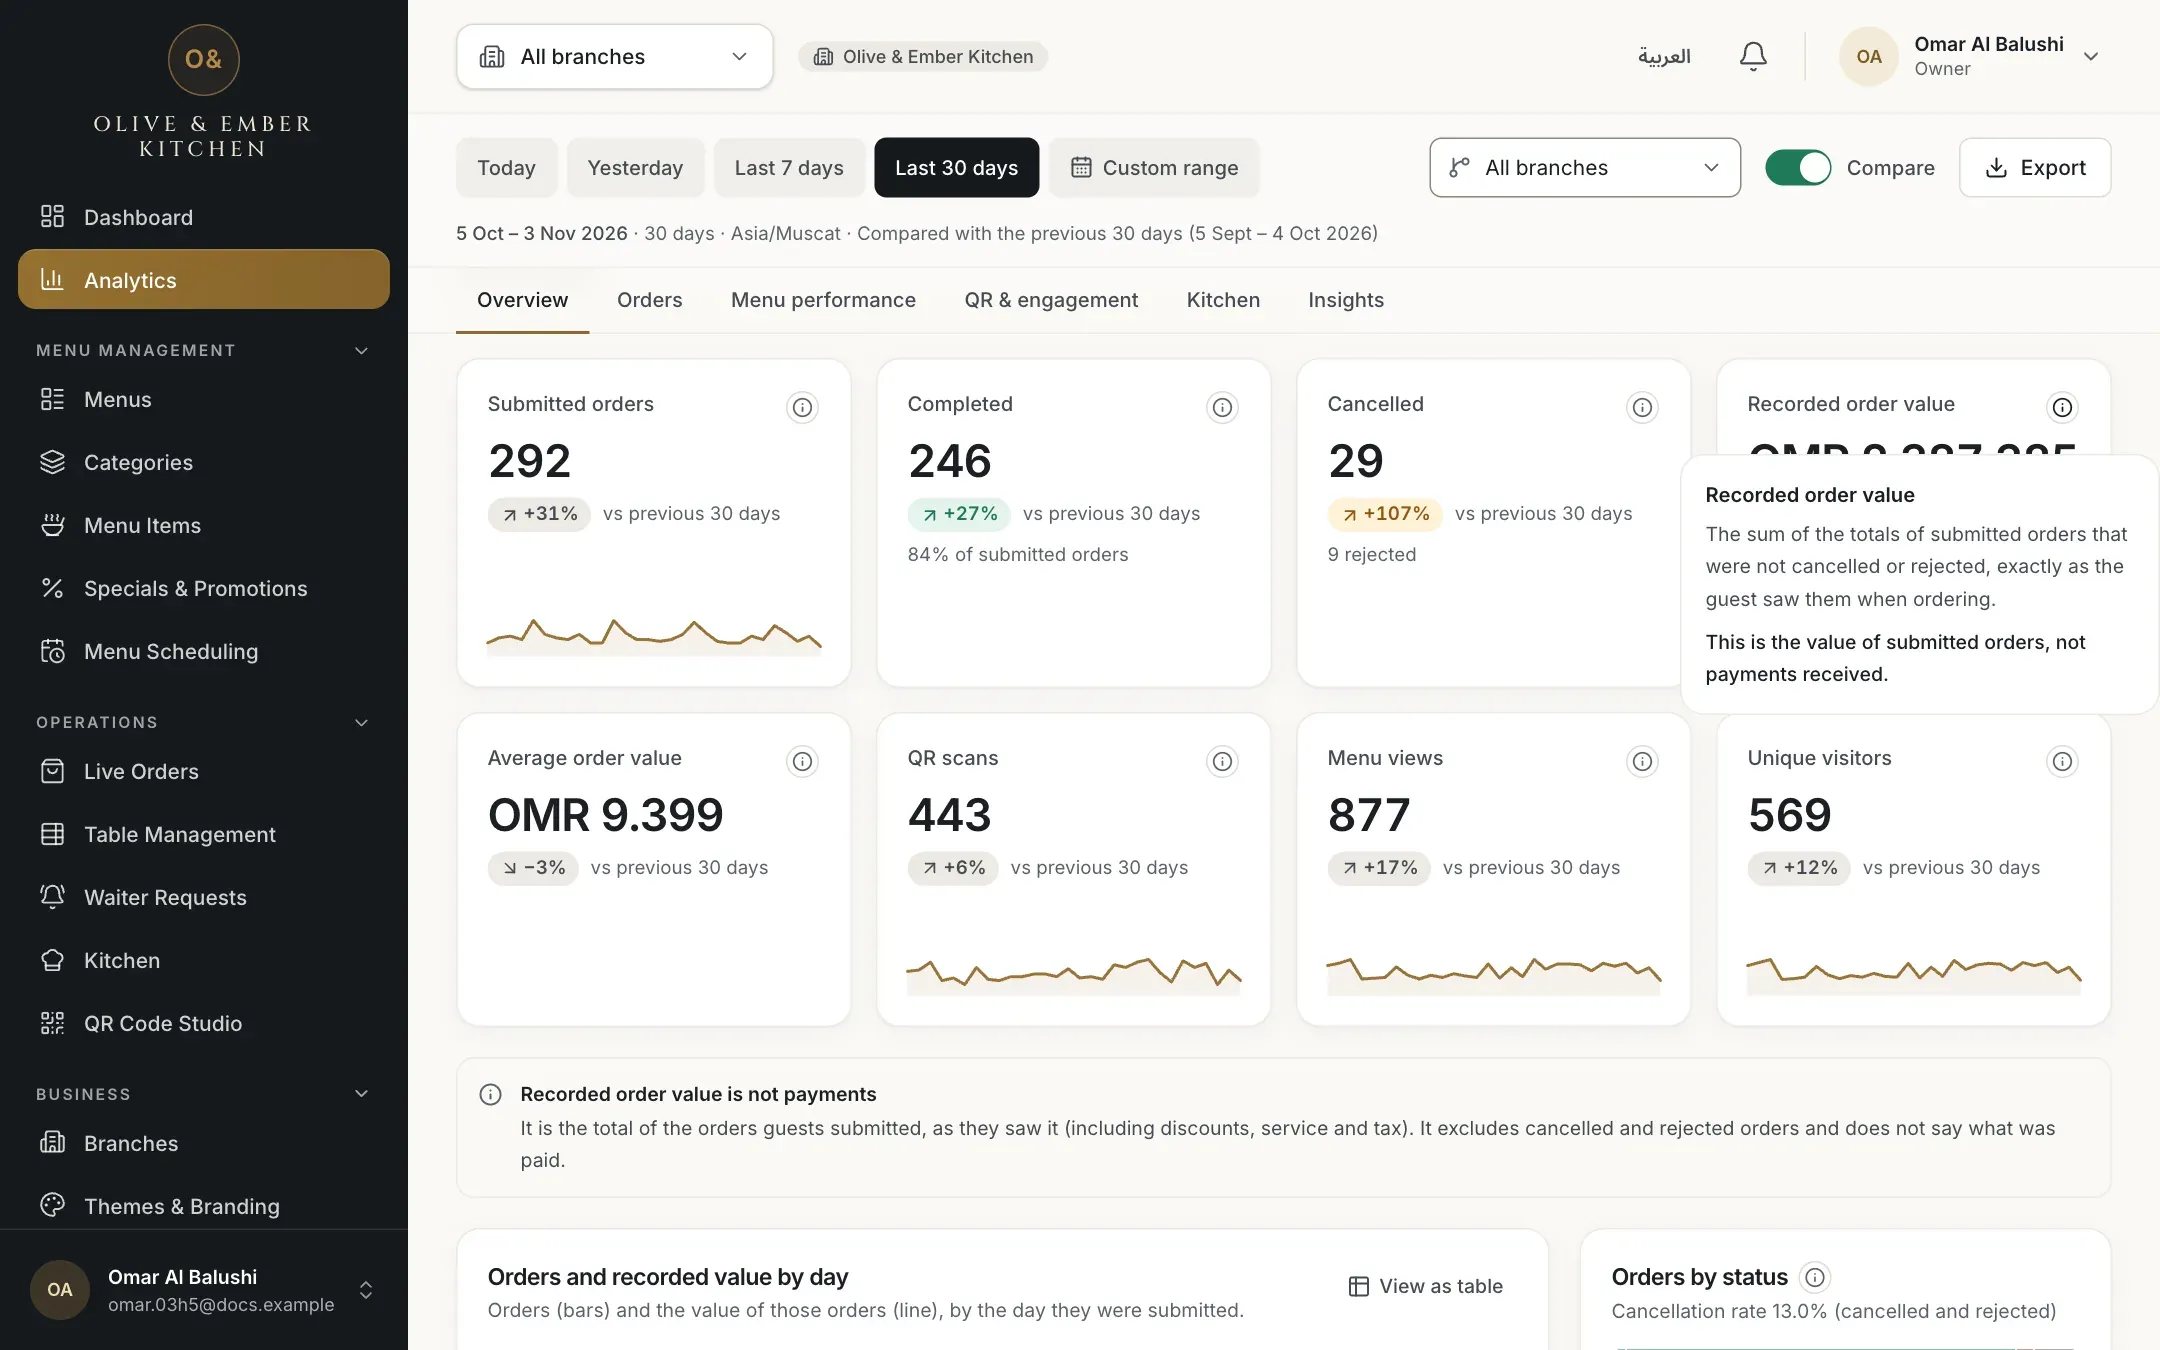
Each card has an information button. Click it to read in plain words how the figure is counted. Under the cards, a notice repeats that recorded order value is not payments.
- The information button of the card
- The notice that it is not payments
Read orders and value by day
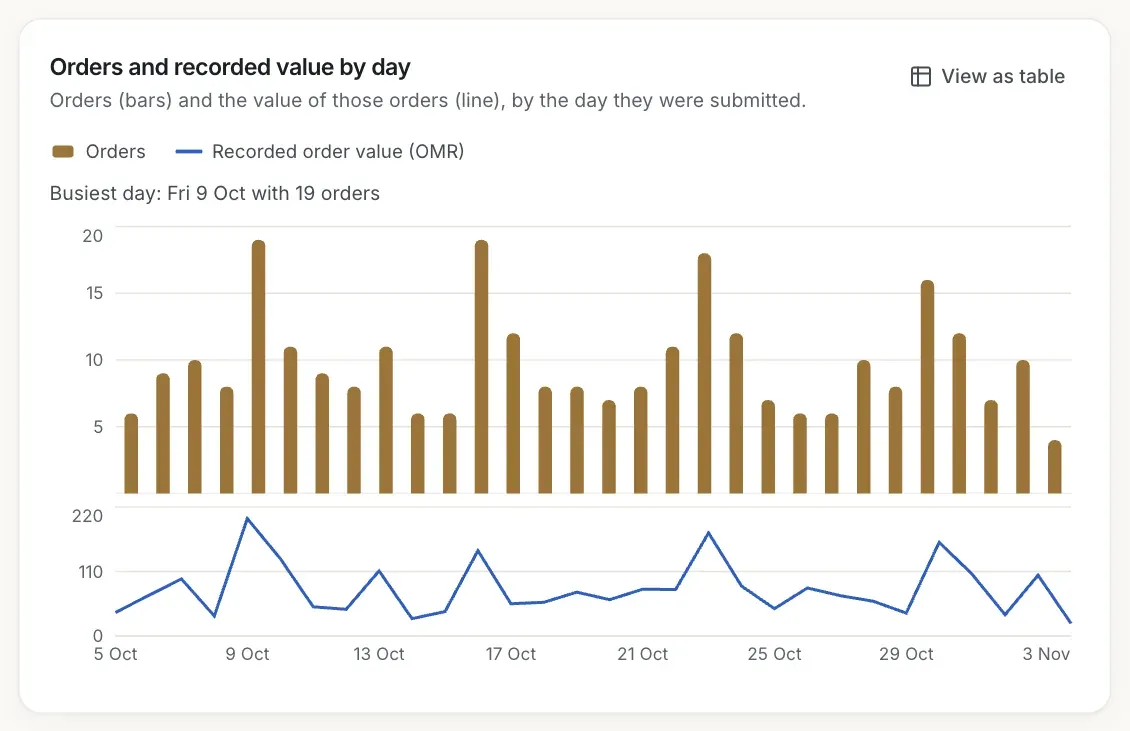
The chart Orders and recorded value by day draws the orders as bars and their value as a line. Days without orders are shown as zero. The text above the bars names the busiest day. Click View as table to read the same numbers as a list.
- The button that shows the chart as a table
Read the status and the cancellation rate
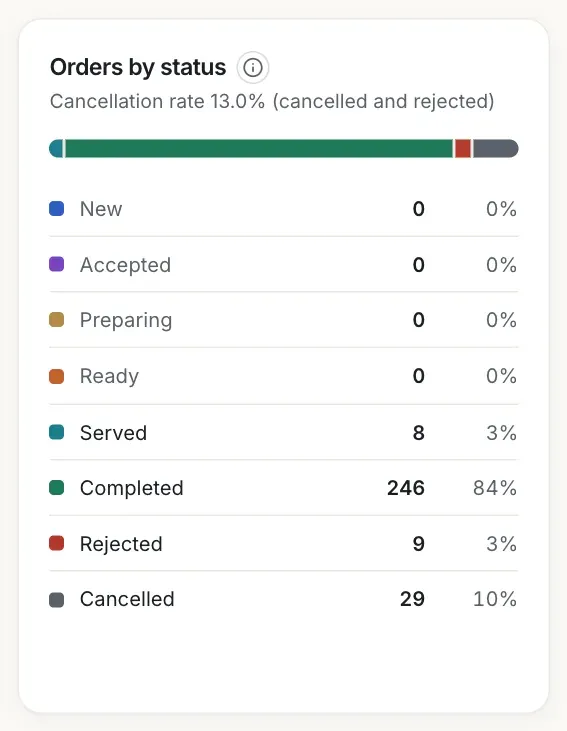
Orders by status lists the orders in every status from New to Cancelled, with their share. The Cancellation rate is the cancelled and rejected orders divided by the submitted orders. It needs at least 10 orders. Below that the panel says Cancellation rate needs at least 10 orders, because a rate on very few orders would mislead.
Find your busy hours
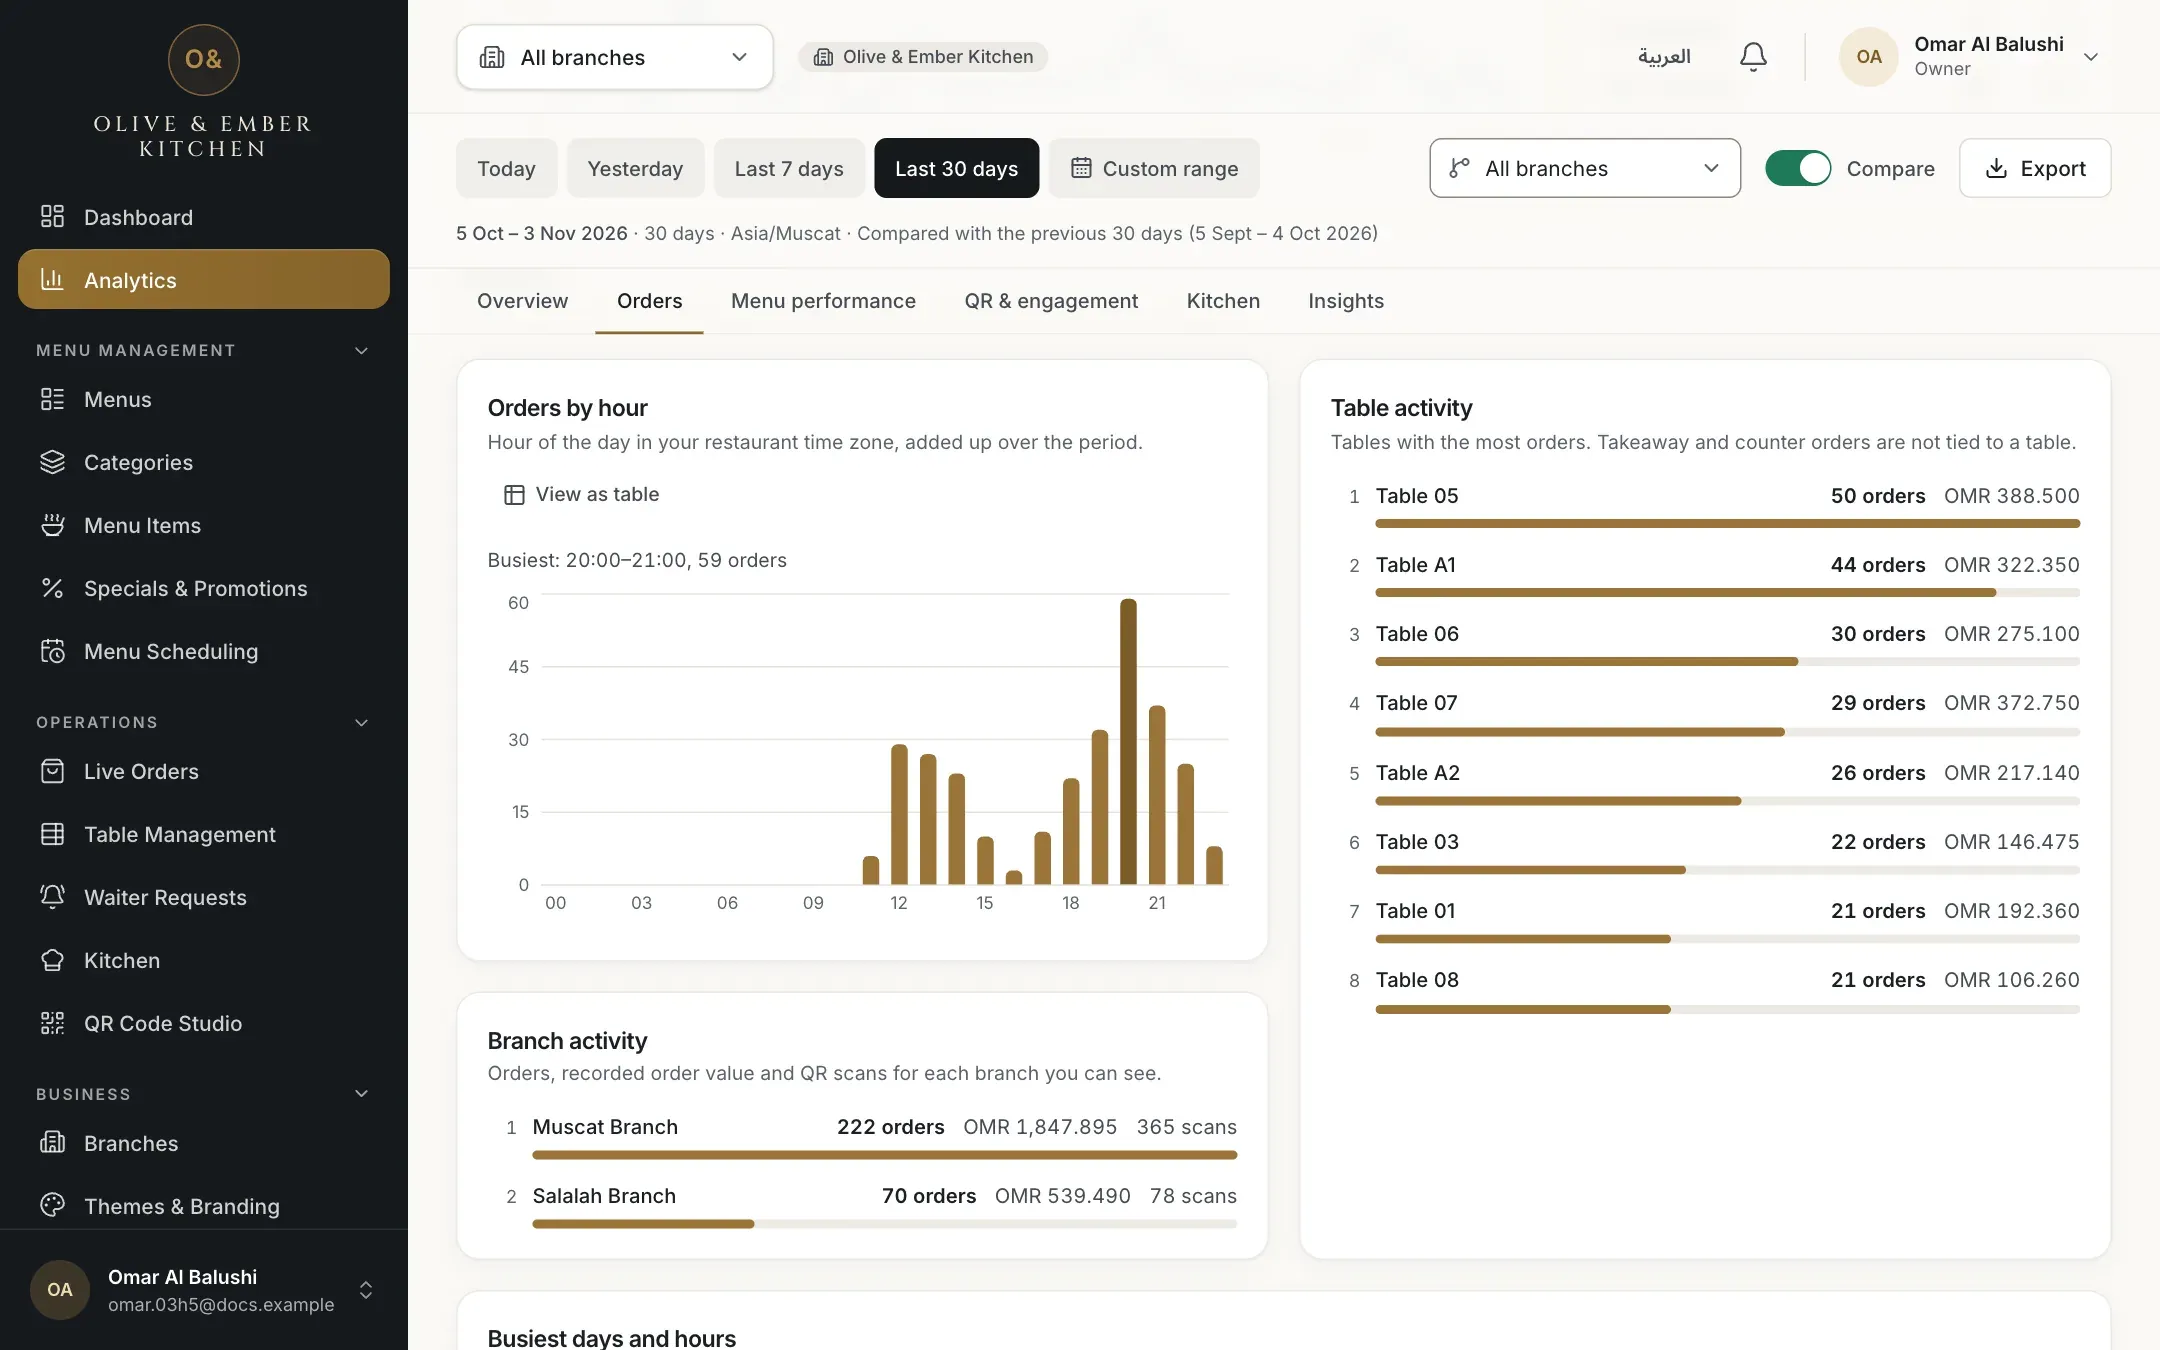
Open Orders. Orders by hour adds up the orders of every hour of the day over the whole period, in your time zone. The text above the chart names the busiest hour.
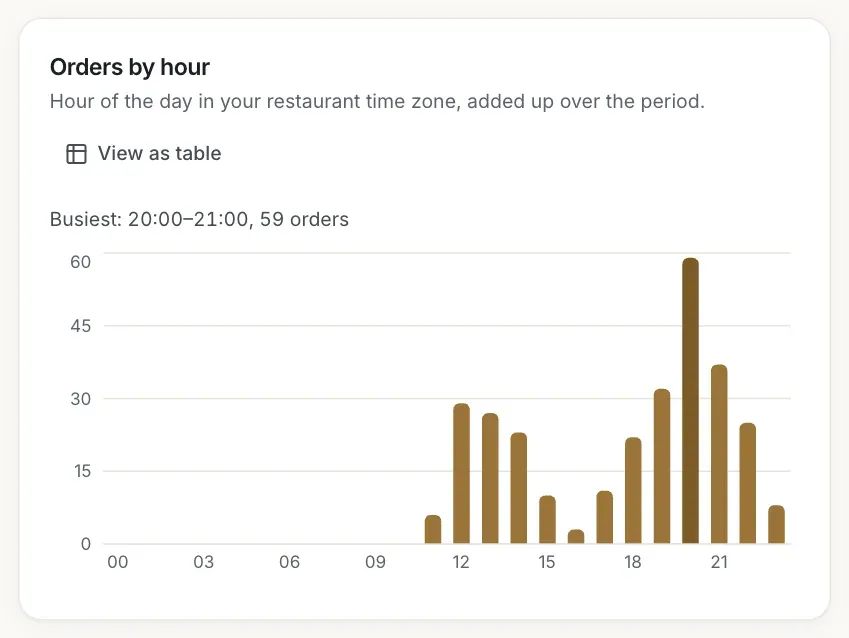
- The button that shows the chart as a table
Read the week grid
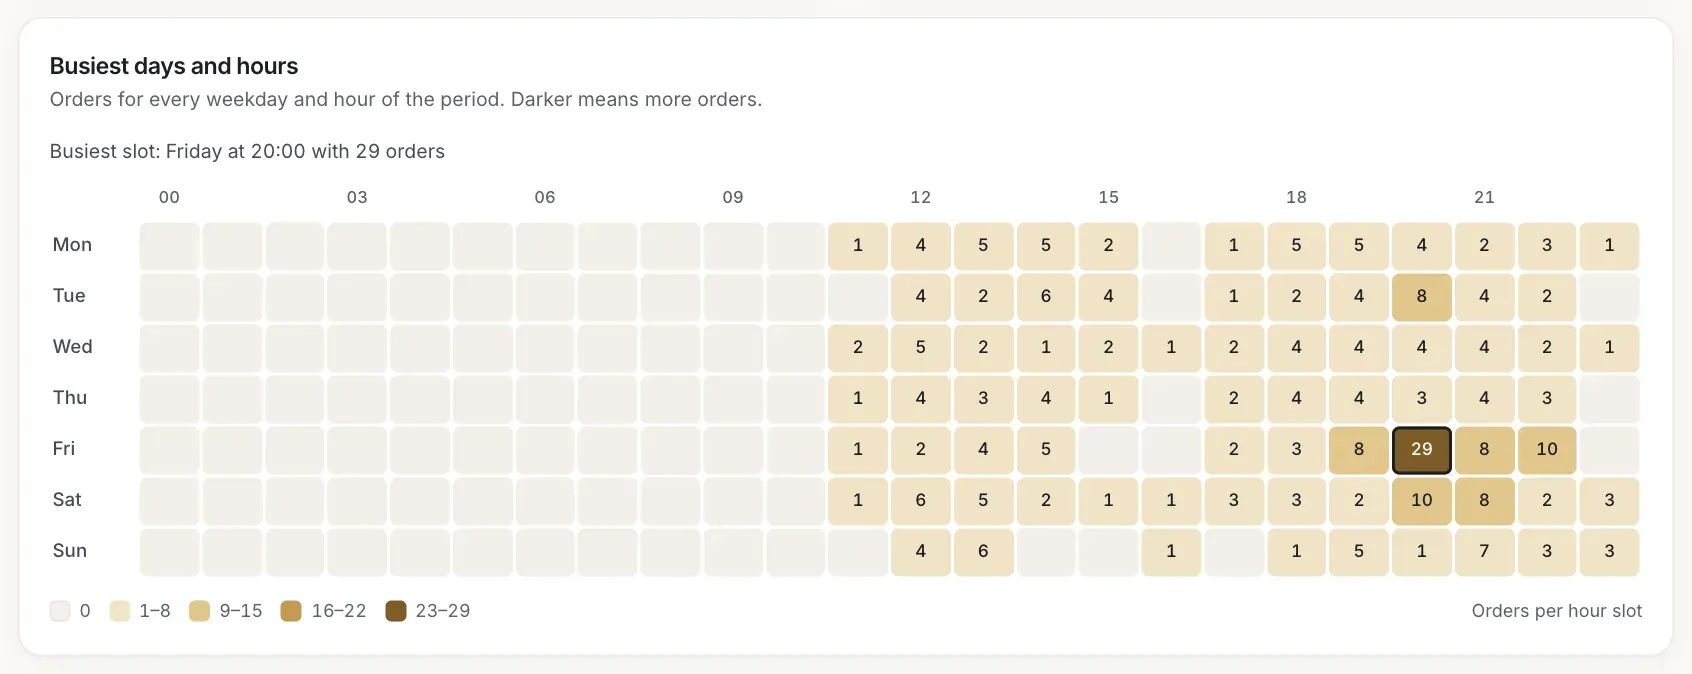
Busiest days and hours has a row for every weekday and a column for every hour. The number in a square is the orders in that hour on that weekday over the period, and a darker square means more orders. The line above names the busiest slot, for example Friday at 20:00.
Compare tables and branches
Table activity ranks the tables with the most orders and shows each table's orders and recorded value. Branch activity shows orders, recorded value and QR scans for each branch you can see. Figures per table or branch add up to the same orders as the cards.
- Table activity
- Branch activity
Troubleshooting
Nothing was submitted in the period you chose, or for the branch you chose. Try a longer period or All branches. Orders appear as soon as guests submit them.
The period has fewer than 10 orders, so a rate would not be reliable. Choose a longer period. The cancelled count on the card is still correct.
The previous period has too few orders to compare fairly (at least 5 for a count or an amount, and at least 10 for a rate). The figure itself is correct.
That is expected. It is what guests ordered, so it does not include what a guest decided not to pay, discounts you gave at the table or tips, and it ignores when and how a guest paid. Use it to compare days and dishes, not to reconcile your cash.
No order came from a table QR code in the period or branch you chose. Orders from table codes appear in Table activity.
Related guides
- Analytics and insightsOpen the Analytics pageOpen Analytics, choose a period, a branch and the comparison, jump between sections and share the view with a colleague.
- Analytics and insightsSee which dishes performFind your most ordered dishes, compare categories and see which dishes and categories guests look at.
- Analytics and insightsExport analytics as CSVDownload seven CSV files for the period and branch you chose, and open them in Excel or Google Sheets, also in Arabic.
- OrdersOrder statusesWhat New, Accepted, Preparing, Ready, Served, Completed, Rejected and Cancelled mean for your guest and for your team, and who can set each one.